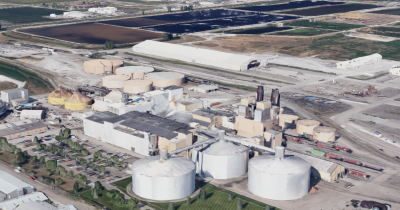
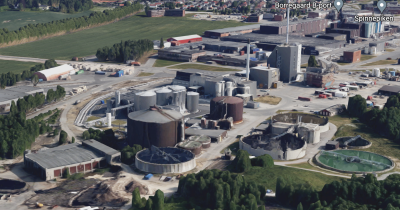
Carbon dioxide can be released from different sources:
- Slow (or deep) carbon cycle (typically fossil fuels). According to the Intergovernmental Panel on Climate Change (IPCC) it referred to the cycle time is more than 10,000 years.
- Fast carbon cycle (typically from biomass) can complete within years (less than 500 years), moving substances from atmosphere to biosphere, then back to the atmosphere.
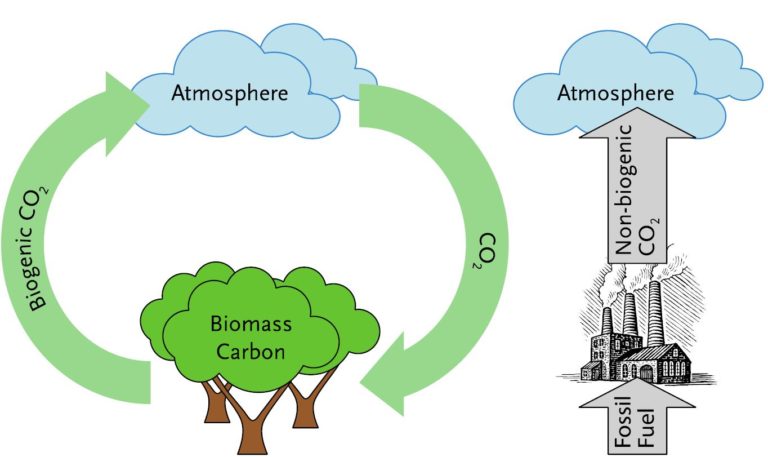
Biogenic vs non-biogenic CO2. IEA, 2023.
Bioethanol plants
Bioethanol plants have large amounts of biogenic CO2 emissions because they use natural biological processes to convert plant materials (such as corn, wheat, sugar beet or sugar cane) into ethanol fuel. During the production process, the plant materials are fermented with yeast, so, bioethanol is produced as a byproduct. Then bioethanol is separated from the fermented mixture and purified for use as a fuel.
Biogenic CO2 emissions are also produced as a byproduct during fermentation. Usually 1 kg of bioethanol produced from corn gives 1 kg of biogenic CO2 from fermentation process and 0,5 kg of CO2 from the rest of production process (could be a combination of fossil and biogenic, but typically it is fossil). Therefore, bioethanol plants often have CO2 emissions with approximately 70% biogenic CO2.
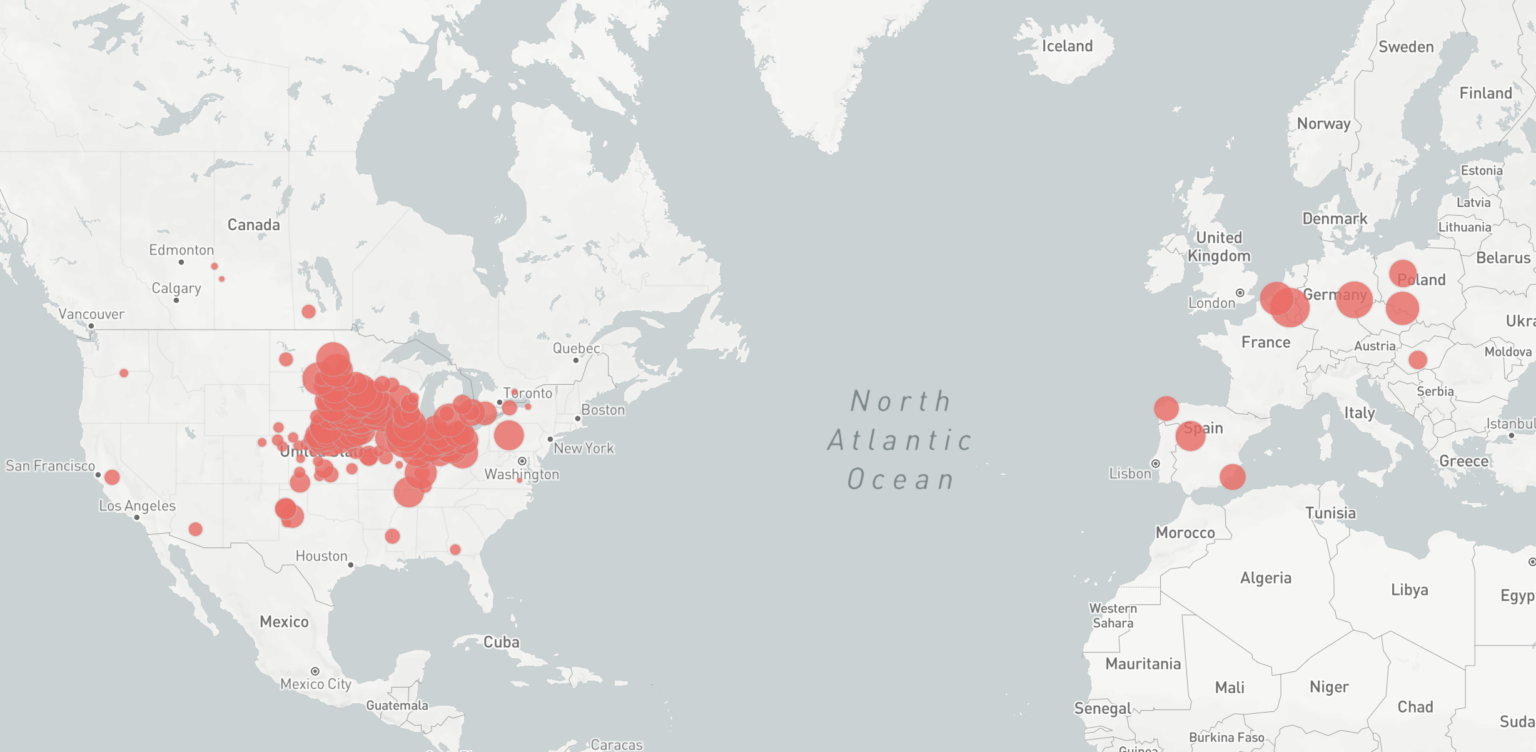
Bioethanol plants in Europe and North America. Source: CaptureMap from Endrava.
The number of plants
- North America — 168;
- Europe — 15.
Annual emissions
- Fossil CO2 — 21.8 million tons;
- Biogenic CO2 — approximately 44 million tons.
CO2 concentration
Biogenic CO2 from fermentation has the highest concentration, with around 80-90%. This makes it a very promising source of CO2 for Bio-CCS technology. The fossil part of emissions often comes from power generation in place, with a much lower concentration, typically 2-5% CO2.
Examples
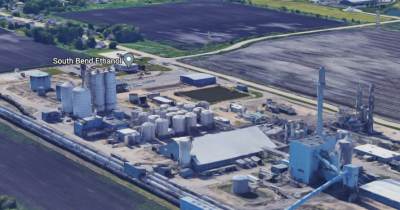
Bioethanol plant in South Bend (USA), as well as Navigator CO2 Heartland Greenway and Summit Carbon Solution (two large projects for pipelines collecting CO2 from ethanol plants).
Biomass power plants
Biomass power plants use various types of bio-based fuels to produce power and/or heat. Many of these plants were originally designed and built to use biomass, while some other are converted from other fuels (typically coal). Moreover, some plants also use a mix of various fuel types (including both biomass and fossil fuels), therefore the share of biogenic CO2 at power plants can vary greatly, anywhere from 0 to 100%.
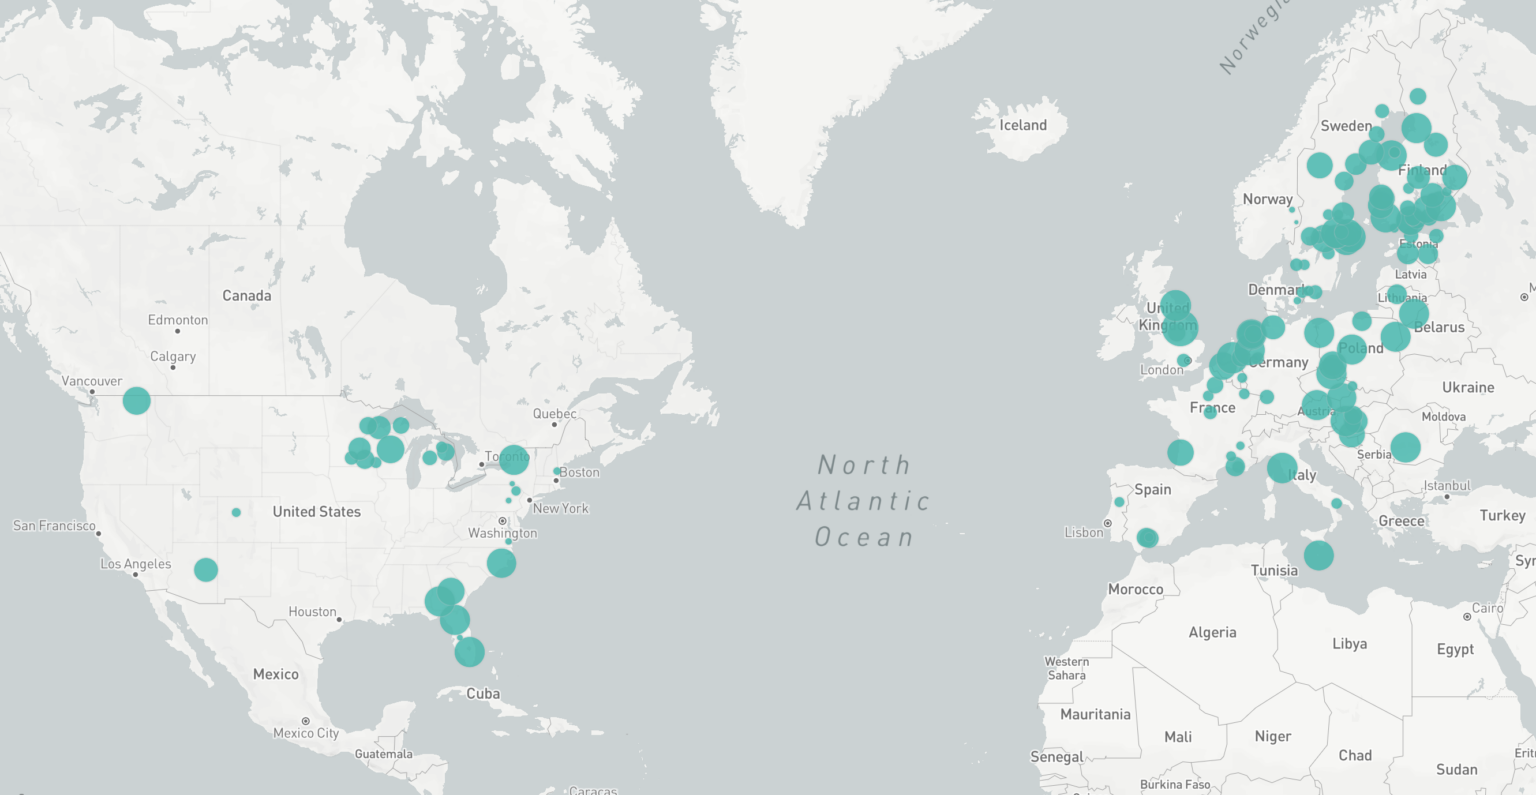
Power and heat plants with biogenic CO2 emissions over 50% in Europe and North America. Source: CaptureMap from Endrava.
The number of plants (where 50% of the emissions consist of biogenic CO2)
- North America — 26;
- Europe — 111.
Annual emissions
- Biogenic СО2 — approximately 52.8 million tons (46 million in Europe and 6.8 million in the USA).
CO2 concentration
The concentration varies between 5% and 15%, depending on the type of fuel used and the combustion process employed. It is theoretically possible to capture about 90% of the emitted CO2. Thus, significant amounts of biogenic CO2 can be captured from biomass power plants worldwide, offering substantial potential for the Bio-CCS concept.
Examples
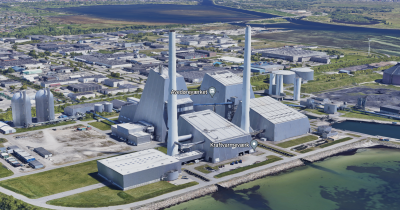
Several biomass power plants have Bio-CCS project including: the Ørsted Avedøre and Asnæs power stations (Denmark), the Drax power station (UK), ENSO and Carburos Metalicos (Spain).
Waste to energy plants (WtE)
WtE burn waste to produce heat and electricity. It is often municipal waste with a mix of various fractions, including plastics, food, paper, and other types of materials. On average, about half of the waste contains carbon of biological origin (e.g. from food and paper), and therefore about 50% of the CO2 emitted from the WtE plants is biogenic. Based on reporting data from 112 different WtE plants in Europe and USA, the average biogenic share in their CO2 emissions is 59%, with variations from facility to facility.
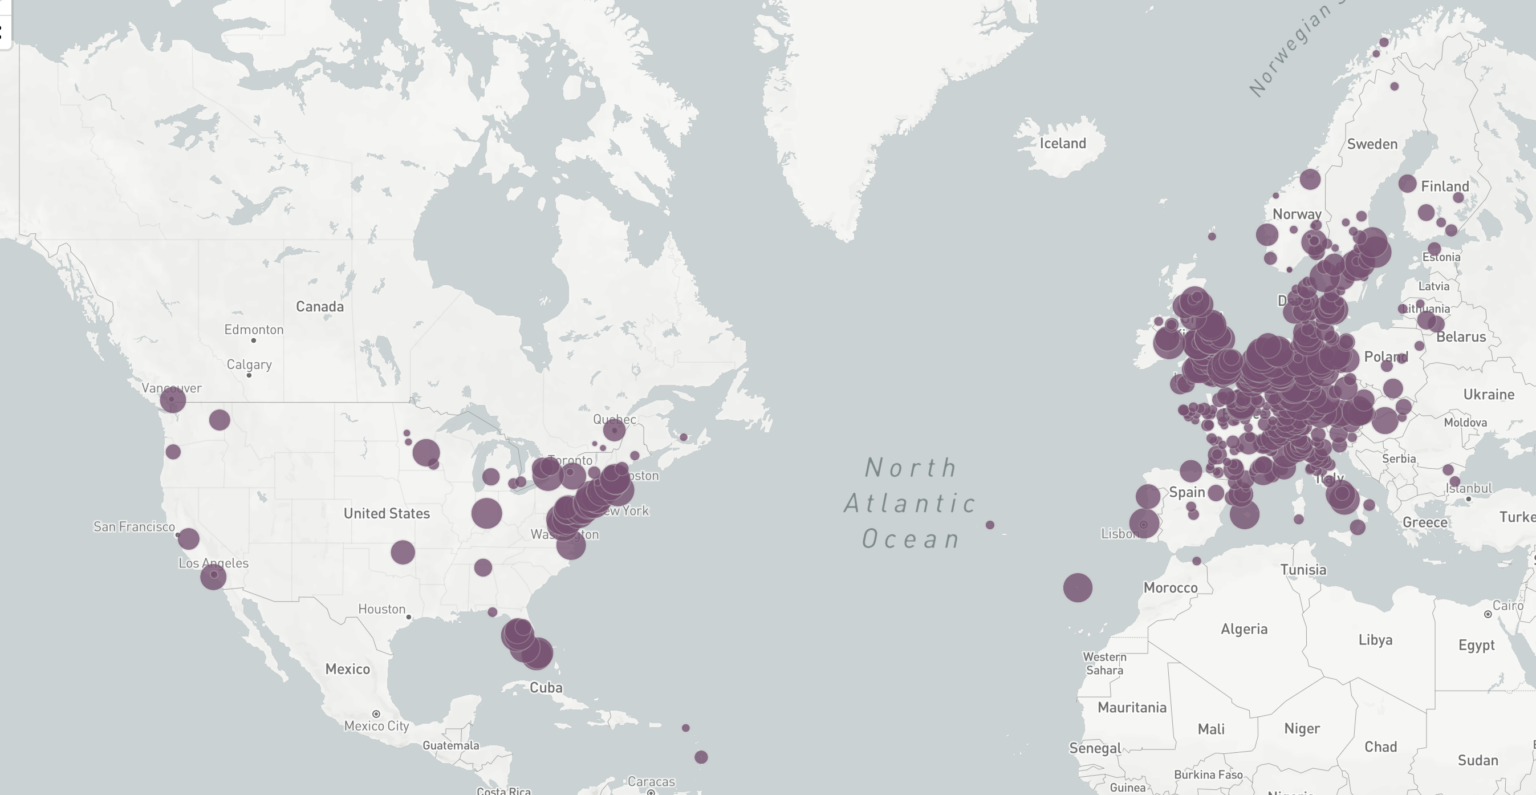
Waste-to-Energy plants in Europe and North America. Source: CaptureMap from Endrava.
The number of plants (Europe and North America):
- 112 (biogenic CO2 share of 59% or more);
- 489 (biogenic CO2 share of less than 59%).
Annual emissions:
- Biogenic CO2 — 52 million tons (Europe and North America).
CO2 concentration:
The CO2 concentration typically varies from 5% to 15%. Most plants have one to a few stacks in the vicinity of one another, simplifying the capture. Capture projects on WtE plants has shown that capture rates of 90%, or more, are achievable, providing great opportunities for Bio-CCS projects.
Examples:
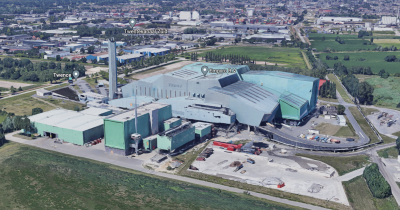
Bio-CCS is being implemented at: Twence Hengelo (Netherlands), Hafslund Oslo Celsio Klemetsrud (Norway, project on hold at the time of this writing), KVA Linth (Switzerland) і Viridor Runcore (UK), among others.
Cement plants
It often comes as a surprise that cement plants emit biogenic CO2. After all, almost 60% of the cement emissions come from the production process, which involves limestone, a substance literally made of fossils. These process emissions are generated during the chemical reaction that occurs when limestone and other materials are heated in the cement kiln to create clinker, the main ingredient in cement. This reaction releases CO2 as a byproduct.
Energy-related emissions, on the other hand, are primarily generated by the combustion of fuels in the cement kiln to provide the high temperatures. Cement plants use of many different types of fuels, mostly of fossil origin, but also sewage sludge, wood waste, animal waste and many other types of biomass-based fuels. As a result, the CO2 emissions from many plants contain 5% to 15% biogenic emissions.
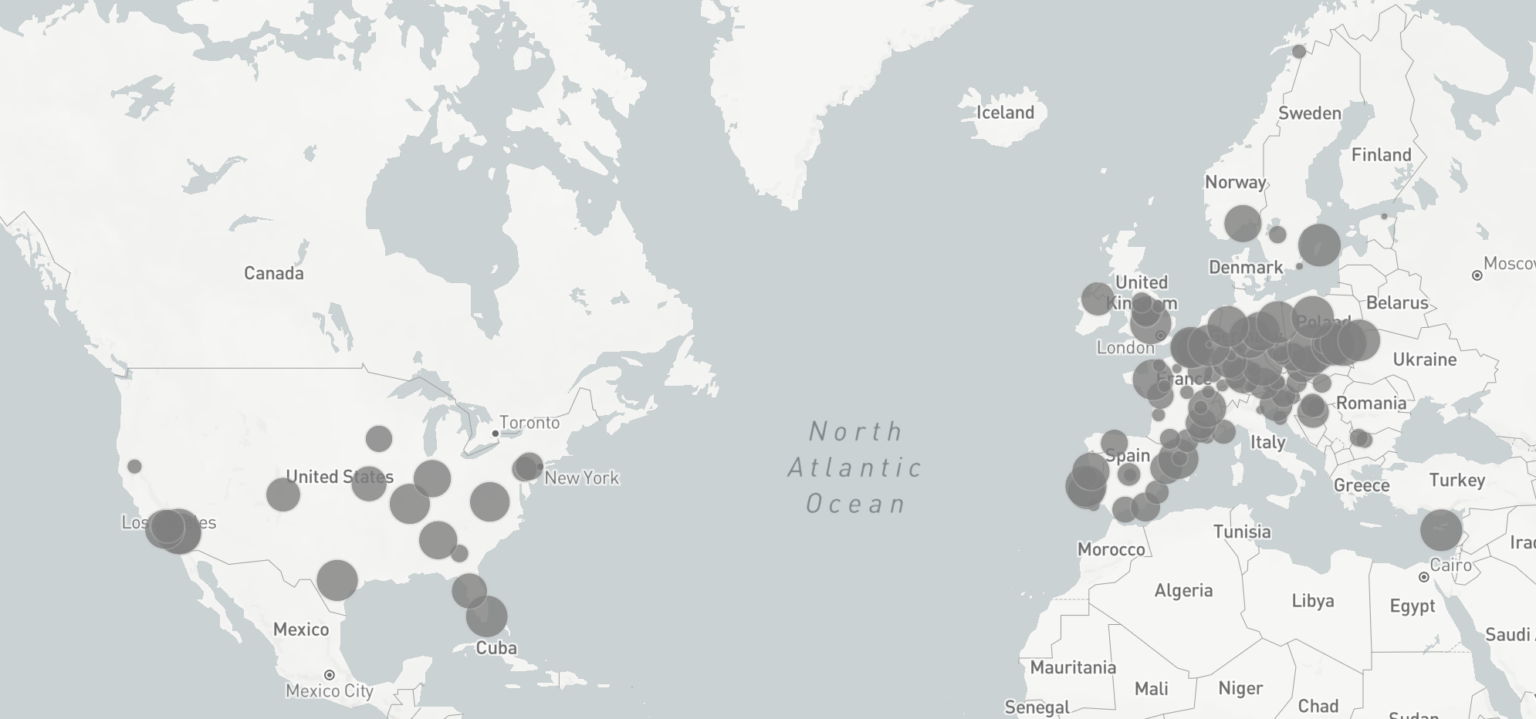
Cement plants with biogenic emissions in Europe and North America. Source: CaptureMap from Endrava.
The number of plants:
- North America — 21;
- Europe — 93.
Annual emissions:
- Biogenic CO2 — approximately 6.2 million tons (5.4 million in Europe and 0.8 million in the USA).
CO2 concentration:
In the exhaust fumes varies from 15 to 30%, depending on the fuel used and the share of emissions from process. Each facility may have one to multiple emission points, depending on the plant’s construction. Some cement plants have waste heat available, which can help reduce the capture costs. As a result, capture rates of up to 70 to 90% of the CO2 are achievable.
Examples:
Several cement plants have capture projects in the making, with some share of bio-CCS: Norcem Brevik (Norway), CBR Antoing (Belgium), Lehigh Redding (USA), Cementa Slite (Sweden) and Holcim Obourg (Belgium), among others.
Pulp and paper
Pulp and paper production involves the processing of wood or other plant-based materials to produce paper, cardboard, and other paper products. Biogenic CO2 emissions occur during the pulping process, which is the process of breaking down the plant material to extract the cellulose fibers. In addition, other steps can also contribute to biogenic CO2 emissions (for example, the energy used to power the production process may come from the burning of biomass).
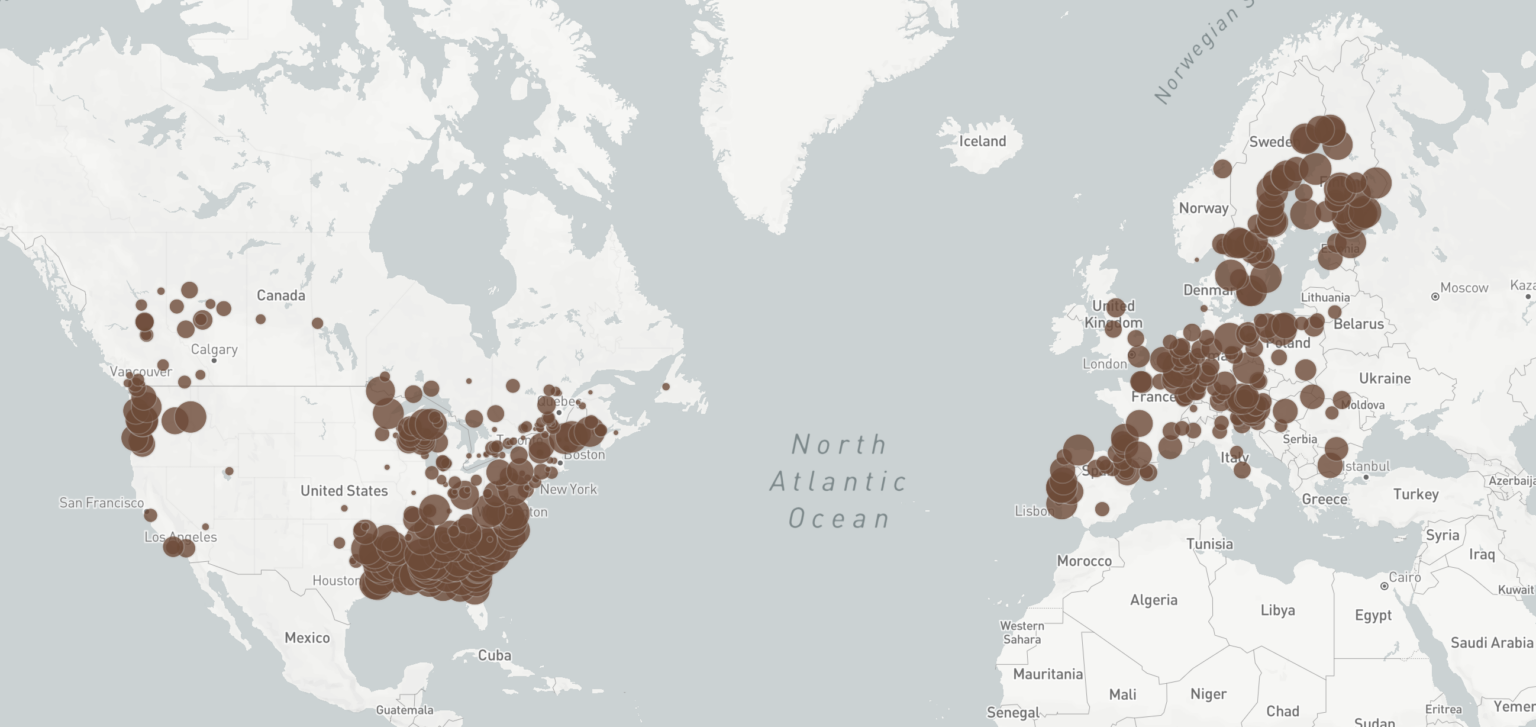
Pulp and paper plants with biogenic emissions in Europe and North America. Source: CaptureMap from Endrava.
The number of plants:
- North America — 156;
- Europe — 130.
Annual emissions:
- Biogenic CO2 — 181 million tons (80 million tons in Europe and 101 million tons in North America)..
CO2 concentration:
Recovery boilers often account for two thirds of the CO2 emissions and the flue gases include 10% to 15% CO2. The power boilers are typically responsible for 20% of the emissions, and there the flue gases also contain 10% to 15% CO2. The remaining emissions come from lime production on site, which has a CO2 concentration of about 15-30 % in the flue gases.
Approximately 70-90% of total CO2 emissions can be captured, allowing for the processing of large volumes of biogenic CO2 for Bio-CCS projects.
Examples:
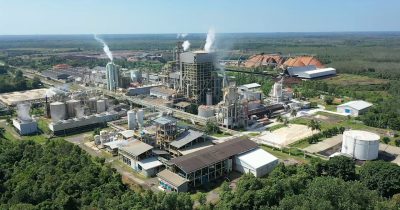
Tanjungenim Lestari Pulp & Paper (Indonesia) — a Bio-CCS project in the pulp and paper industry.
Alcohol and sugar production
In alcohol production, biogenic CO2 is released through the fermentation of organic materials (such as corn, barley, and sugarcane). During the fermentation process, yeast is added to the organic material to convert the sugars into alcohol. In addition to the fermentation process, other steps in the production of food-grade alcohol can also contribute to biogenic CO2 emissions. For example, the energy used to power the production process may come from the burning of biomass or other organic fuels.
Biomass is also used as an energy source in the sugar industry. In addition some fermentation may occur during sugar production (depending on the process), leading to biogenic CO2 emissions.
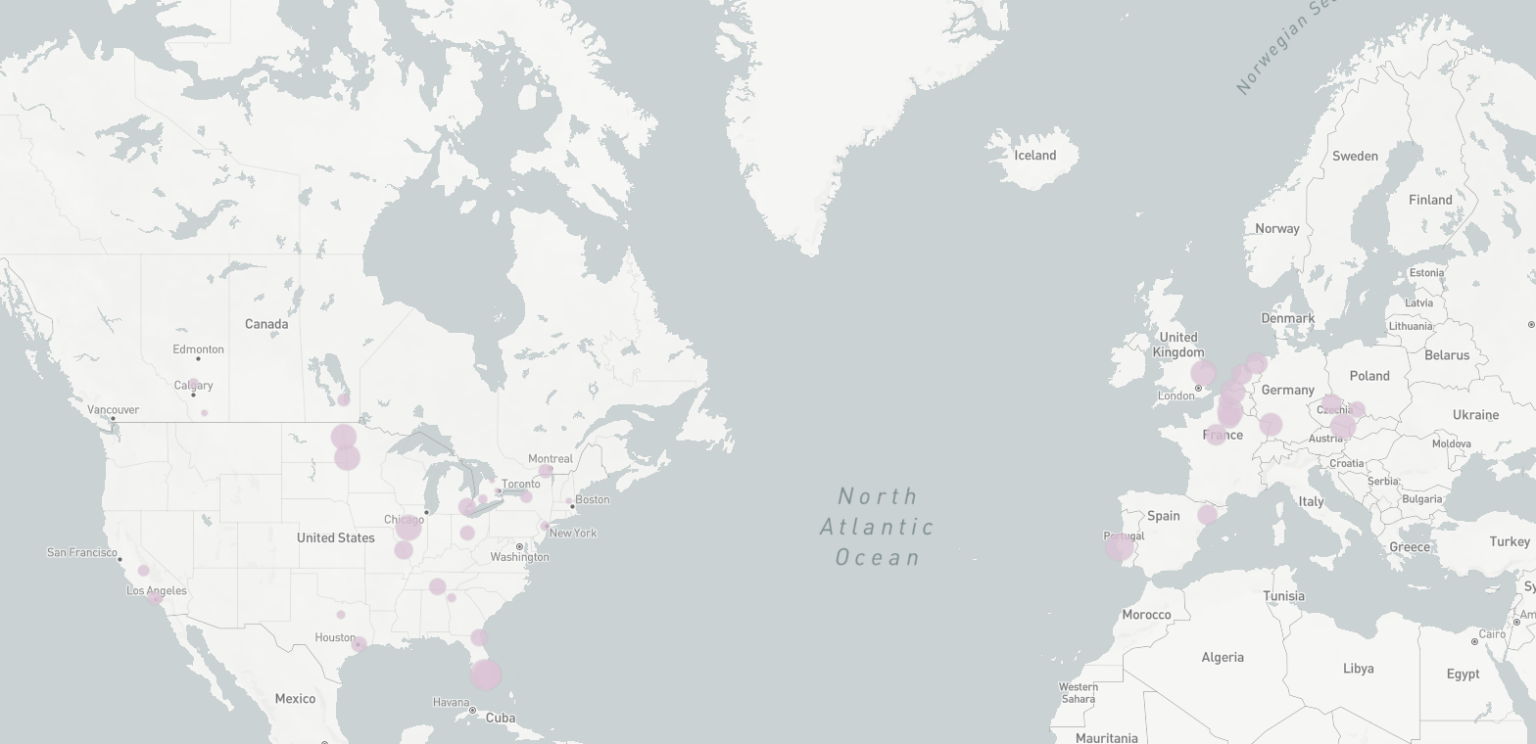
Sugar and alcohol plants with biogenic emissions in Europe and North America. Source: CaptureMap from Endrava.
The number of plants:
- Europe and North America — 47.
Annual emissions:
- Biogenic CO2 — 4.5 million tons (Europe and North America. The emissions may be underestimated if CO2 from fermentation is not accounted for).
CO2 concentration:
Power generation at these plants typically has a CO2 concentration between 2% and 5%. The CO2 concentration from fermentation is much higher and can reach up to 80-90 %. Some sugar production plants also have a lime kiln on site. Thus, it produces 10-20% of emissions, with a CO2 concentration of about 15-30 % in the flue gases. As a result, it is possible to capture up to 90 % of the CO2 emissions from alcohol and sugar plants.
Examples:
At Austin Beerworks Brewery (USA), CO2 is being captured using Bio-CCS technology, albeit on a small scale.
What about biogas plants?
Biogas, also referred to as renewable natural gas (RNG) in North America, is produced through the fermentation of food waste and other biomass-based resources into methane. This methane is an excellent renewable energy source, utilized for power and transportation, among other sectors.
The output from the fermentation process typically consists of 65% methane and 35% CO2. However, for most production plants, only the methane fraction is commercially valuable. It is leading to the separation and on-site venting of the CO2. This CO2 stream has a high concentration, typically over 98% CO2, making it an attractive opportunity for collecting biogenic CO2 at low cost.
A downside is that most biogas production plants release limited amounts of CO2. It is ranging from 10 000 tonnes per year for medium-sized plants to 40 000 tonnes per year or more for larger ones. Additionally, CO2 emissions are often not publicly reported in most countries, making it challenging to monitor the availability of biogenic CO2 volumes from biogas production plants.
Source: CaptureMap.
