The implementation of bioenergy projects on marginal and unproductive lands requires a comprehensive assessment.
Working together to improve access to reliable, affordable, efficient, and clean renewable energy services is a priority for sustainable development. The main goal is to promote economic growth through more efficient use of energy and expand the use of renewable energy sources, including bioenergy.
Today, leaders at all levels face the important task of effectively choosing energy solutions that take into account the national features of the regions. Therefore, it is time to create and apply sustainability tools that simplify the process of making effective decisions.
Features of the project
The BIOPLAT-EU project aims to assist in effective decision-making on bioenergy projects by providing a webGIS tool for sustainability assessment.
The concept of BIOPLAT-EU sustainability assessment for bioenergy, developed by the Food and Agriculture Organization of the United Nations (FAO), is to create a modern tool and methodology for studying the impact on sustainability, as well as monitoring sustainability.
The concept of sustainability assessment is structured as an analysis of the difference in impacts caused by two (or more) forecast scenarios: baseline and target (within the target region). For each sustainability indicator, there is a projection into the future of the conditions expected without the implementation of the bioenergy project (baseline scenario) and with the implementation of the bioenergy project (target scenario).
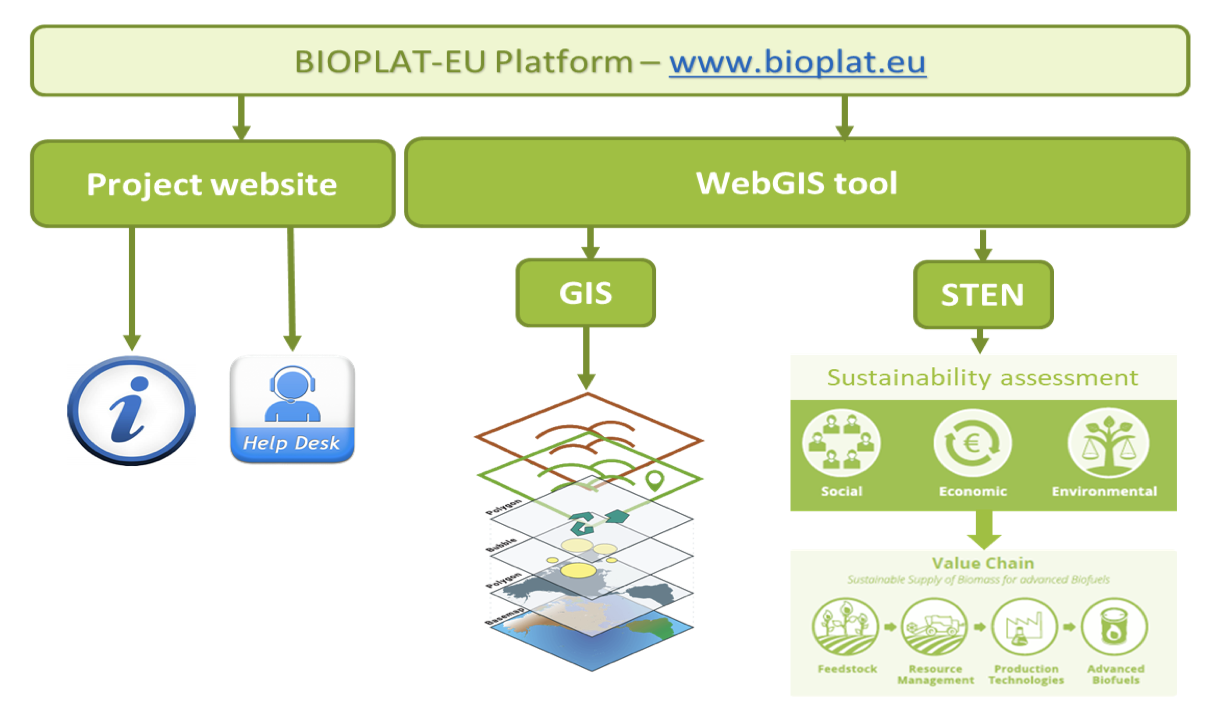
It is worth noting that the FAO has developed a separate tool for assessing the sustainability of bioenergy projects (Sustainability Tool for Europe and Neighboring Countries – STEN). And the webGIS tool of the BIOPLAT-EU project was formed by integrating and combining geospatial data and the STEN tool to perform estimates of the sustainability of bioenergy production in Europe and Ukraine in particular. Importantly, this tool is free.
Geospatial data of the BIOPLAT-EU webGIS tool contain a geographical map and a set of basic layers with information data, as well as GIS maps of lands identified as marginal or unproductive in Europe and Ukraine. It is based on the analysis of satellite images [1] and other input geodata collected by project partners.
Let us share information on how to work with the tool.
The main page view of the BIOPLAT-EU webGIS tool
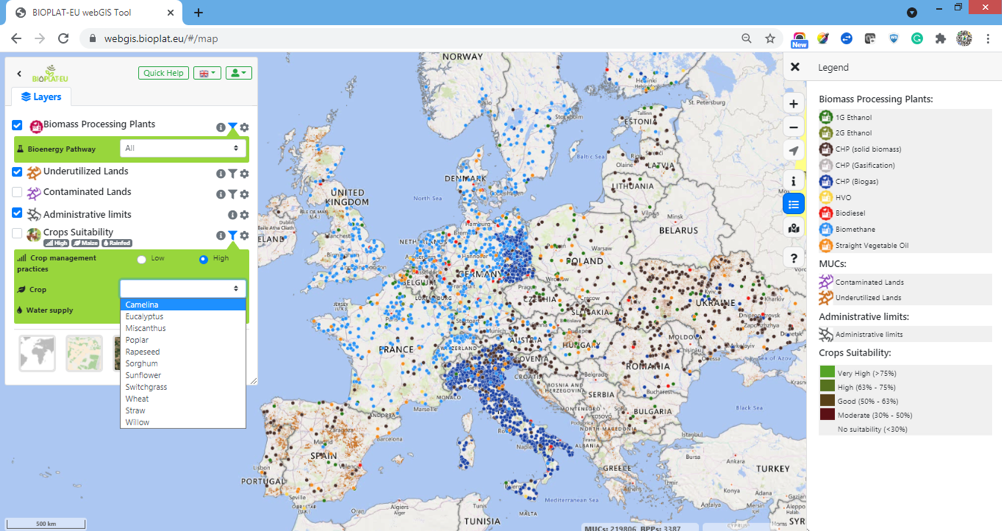
Using the map, the user can search and browse specific areas on it to perform a sustainability assessment.
Steps that are needed to perform a sustainability assessment
- Find the region on the map on the website: https://webgis.bioplat.eu/.
- Identify an area with unproductive land where biomass production can be placed (you can select several areas or identify a piece of land of another shape within one area).
- Choose a Low or High level of care within the Farm Management Practices, which take into account different standards of fertilizer applications, mechanization, and plant protection products.
- Choose the crop for cultivation (depending on the climatic zone, the following crops will be offered: Camelina, Eucalyptus, Arundo donax, Corn, Miscanthus, Poplar, Rapeseed, Sorghum, Glycine max (Soybean), Sugar beet, Sunflower, Panicum virgatum, Wheat, Straw, Willow).
- Choose the bioenergy direction (depending on the selected crop, the following will be offered: 1G Ethanol, CHP (solid biomass), CHP (biogas), Vegetable oil, Biodiesel, CHP (gasification), 2G Ethanol (cellulose), Biomethane, Hydrogenated vegetable oil).
- Select the Biomass Processing Station (depending on the selected bioenergy direction, the nearest station will be proposed, but you can determine the location by marking it on the map).
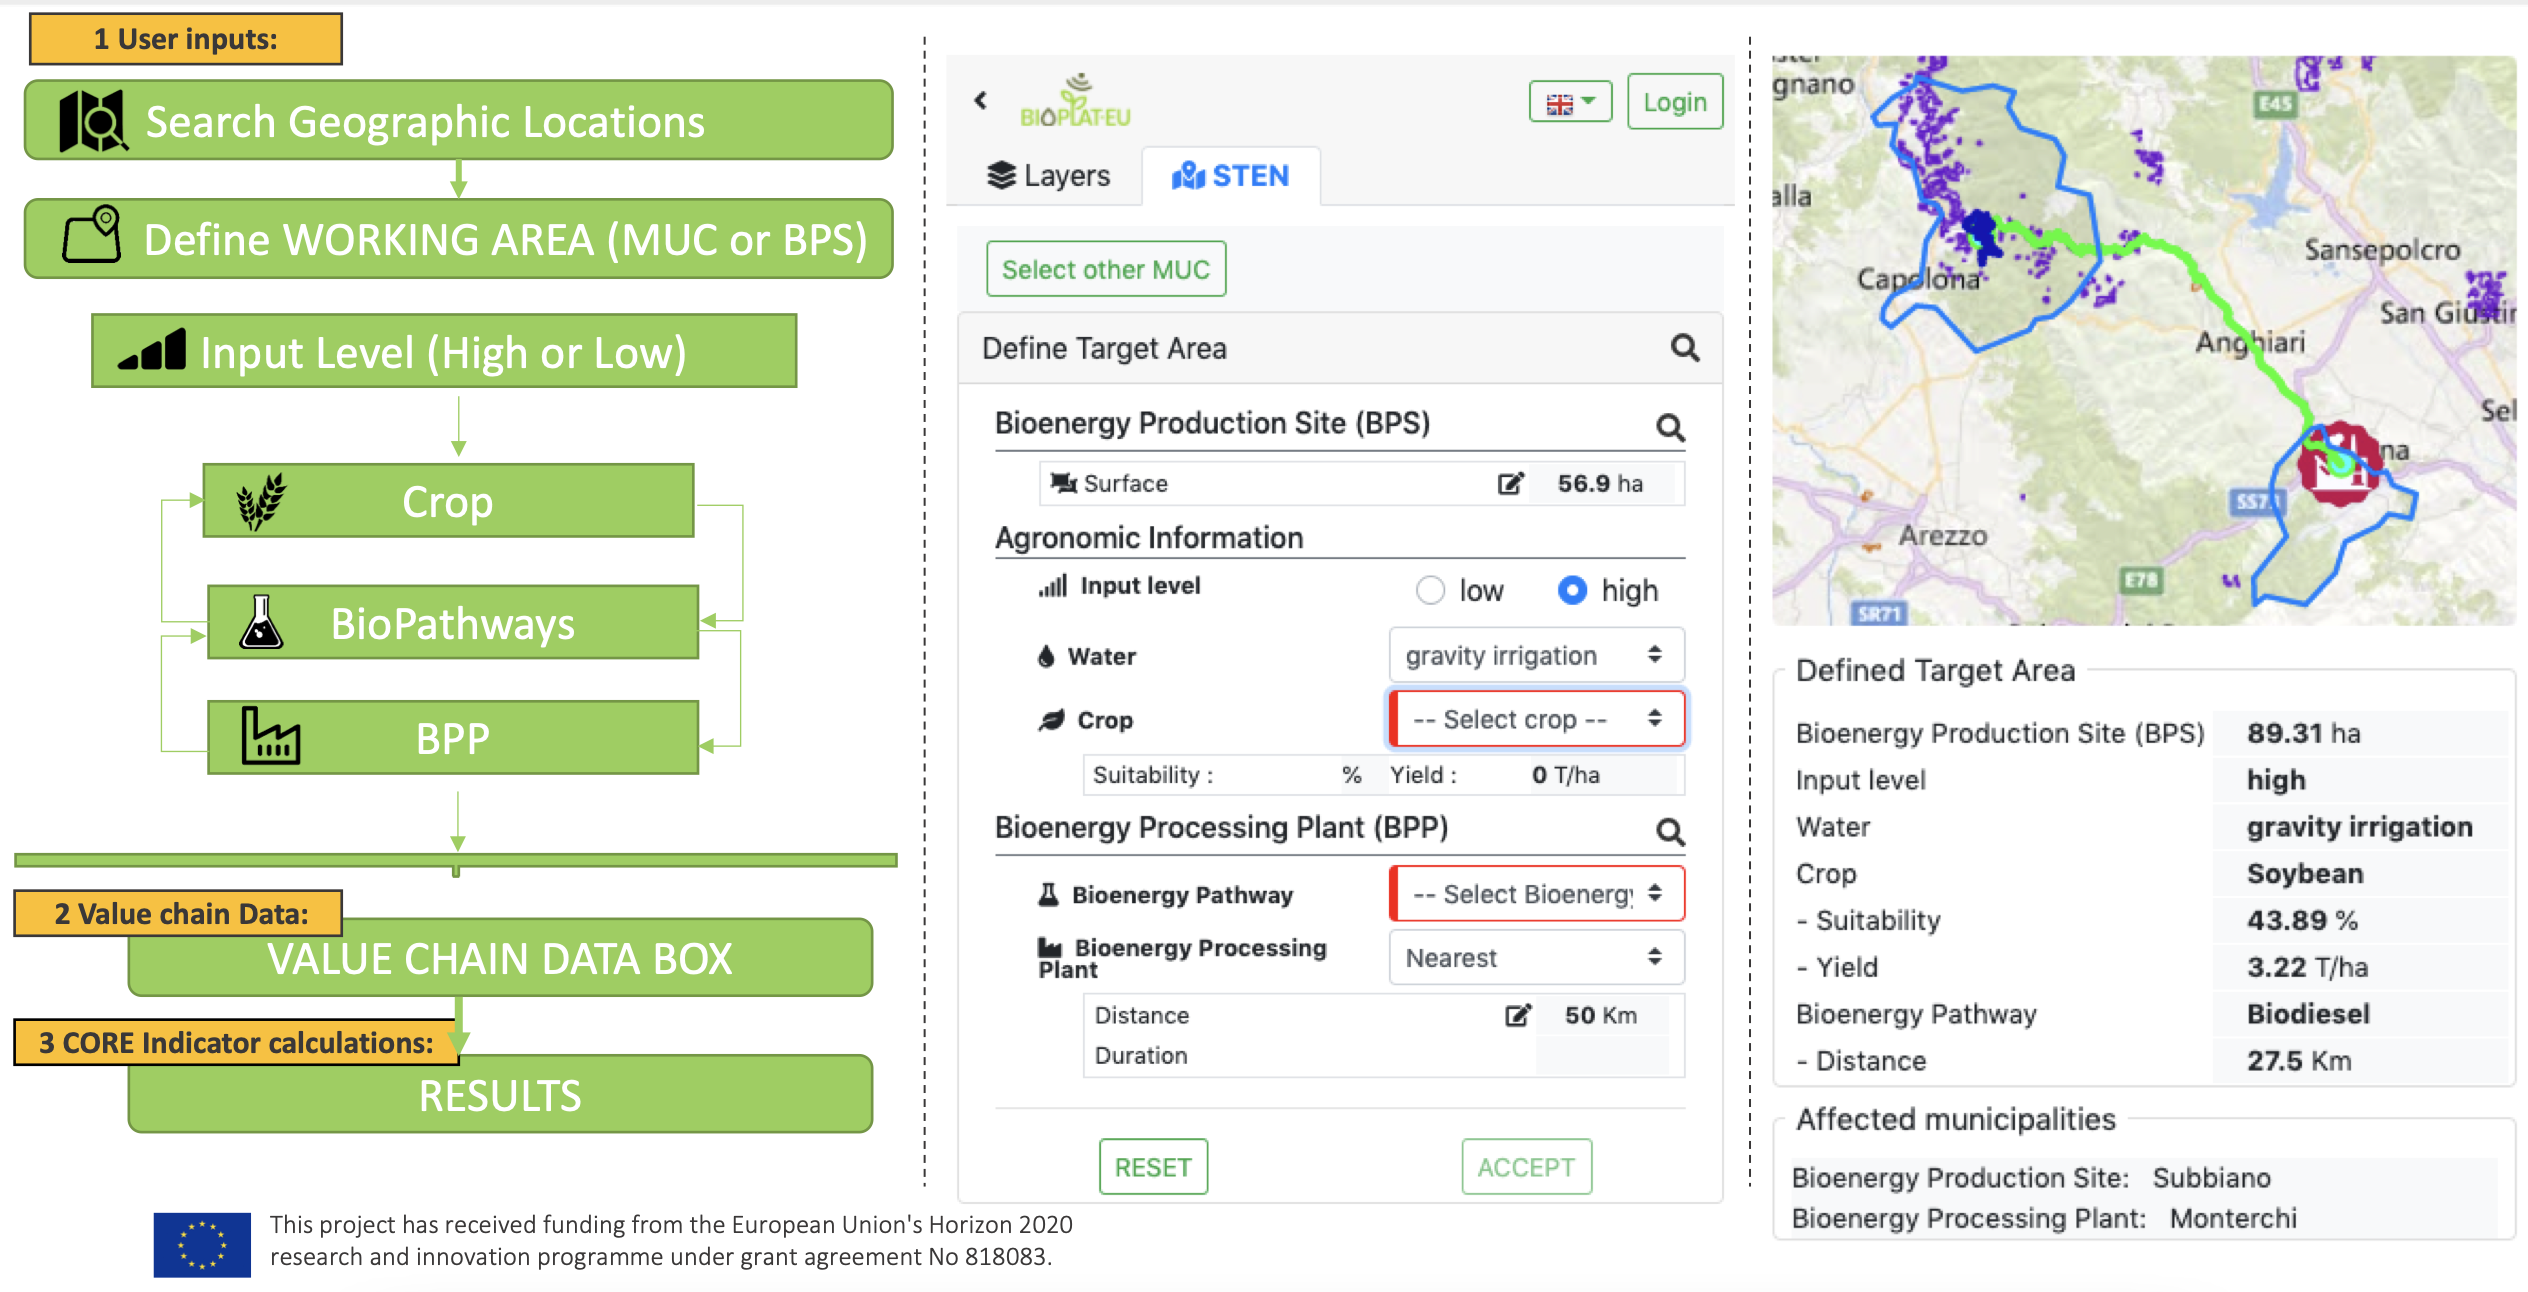
After that, the user will be redirected to the Value Chain Data Box, where he can specify the input data (in case of registration), which will be further used to model the assessment of sustainability.
Sustainability aspects that can be assessed by the user during the modeling of the bioenergy value chain are divided into environmental, social, and techno-economic.
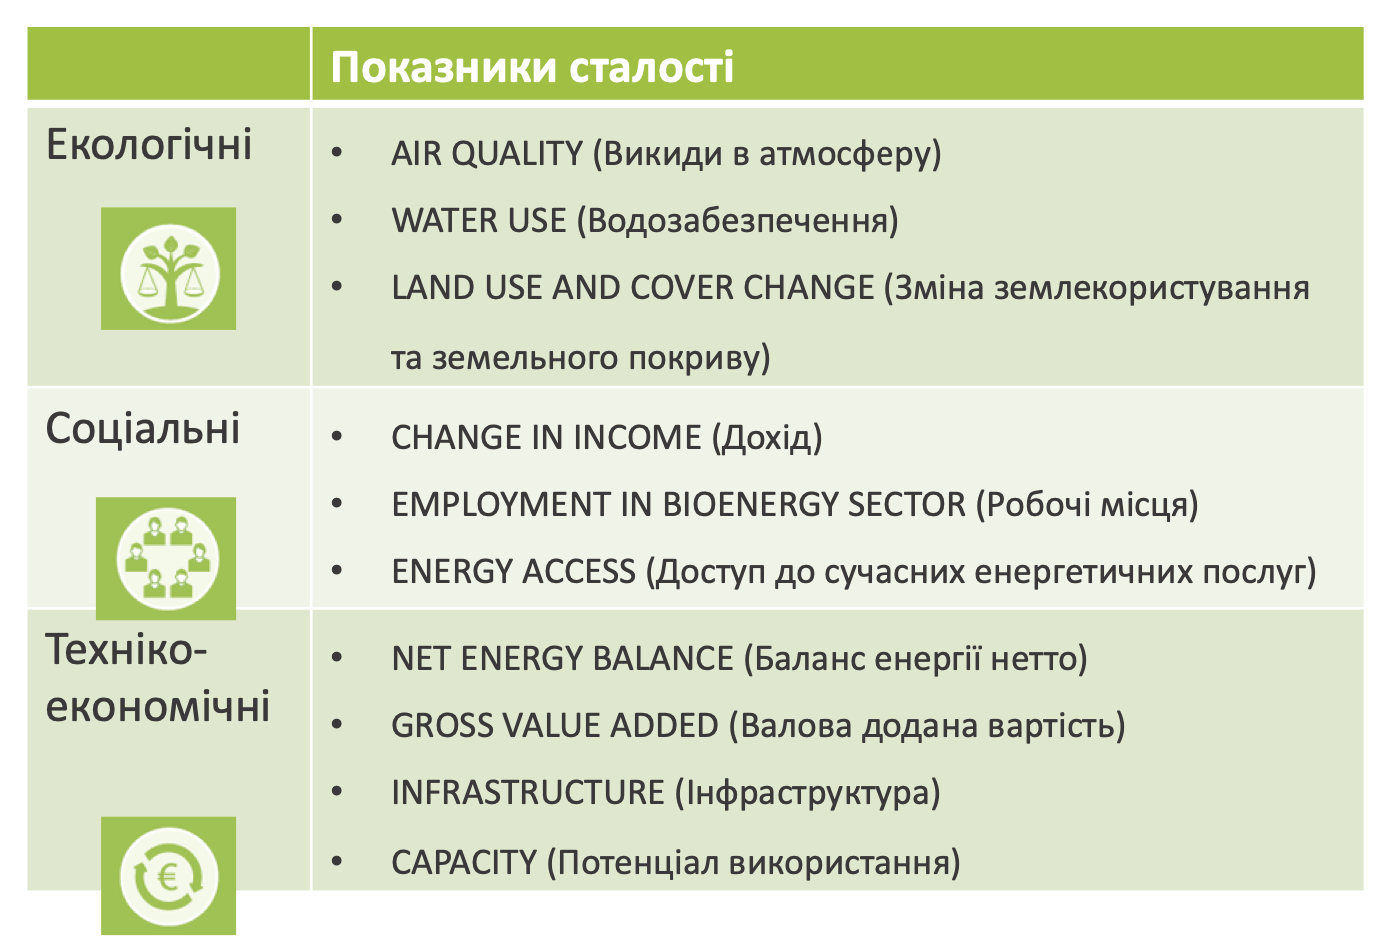
Environmental aspects:
-
Air quality (The intensity of greenhouse gas emissions is expressed in grams of carbon dioxide equivalent per megajoule of bioenergy produced (gSO₂-eq / MJ) and is compared to fossil fuels. It shows the emission reductions that will occur in the region in the case of a bioenergy project with an appropriate set of input data).
- Water use (Shows how much water will be taken from catchments in the target area for the production and processing of bioenergy raw materials. Indicators are provided in cubic meters (m3) and liters (l) per megajoule of energy produced, as well as in cubic meters (m3) per ton (t) of bioenergy raw materials (biomass).
- Land use and cover change (Shows the change in the area of land under annual and perennial crops within the target area, ie those municipalities that will be affected by the implementation of such a bioenergy project).
Social aspects:
- Employment in the bioenergy sector (Shows the number of jobs created throughout the value chain, including permanent and temporary).
- Change in income (This indicator provides information on the profitability of the stage of agricultural production of biomass in the value chain. It is especially important for farmers and biomass producers. It shows the annual gross and net margin at the gate of the farm for the production of bioenergy raw materials (over 20 years).
- Energy access (Shows the additional amount of energy produced from biomass, as well as the contribution that new bioenergy station, depending on the bioenergy direction, can make to electricity supply, district heating, and/or district cooling at three levels: local, national and at EU level. For these three levels the indicator is given as a percentage change, compared to the basic information entered by the user in the Value Chain Data Box).
Techno-economic aspects:
- Net energy balance (It shows the energy efficiency of the value chain and is calculated as the difference between all energy costs at all stages of production to the energy that was produced).
- Gross value added (Shows the monetary value of the produced bioenergy product excludes the value of all materials and raw materials directly related to this production. Also shows the gross value added per unit of bioenergy that was produced (MJ) and as a percentage of gross domestic product).
- Infrastructure (The indicator allows to estimate the time spent on transportation of biomass and bioenergy products within the value chain, taking into account the number and capacity of routes for high important distribution systems).
- Capacity (Shows the contribution of the modeled bioenergy value chain to the existing quotas that the national market, as well as the EU market, could adopt for this particular bioenergy product. In the case of liquid biofuels, this market space is defined as the difference between mandatory blending thresholds for ethanol and biodiesel with efficient consumption of liquid biofuels in each EU Member State (plus Ukraine) by 2020. This figure will show relatively less significant results when electricity is considered as a bioenergy product because the grid’s ability to absorb additional energy produced from biomass is usually several times greater than the power of additional generation).
BIOPLAT-EU provides further recommendations to users of the platform through the support service. You can contact the experts of BIOPLAT-EU and ask them any questions within the project. To do this, use the project website.
![]() This project has received funding from the European Union’s H2020 research and innovation programme under grant agreement No 818083.
This project has received funding from the European Union’s H2020 research and innovation programme under grant agreement No 818083.
[1] Sentinel Earth Remote Sensing Satellites of the European Space Agency were created as part of the Copernicus Global Monitoring for Environment and Security project to remotely monitor and support services such as land use monitoring, forest and water vegetation, Earth change tracking, and disaster tracking.