Common Futures conducted a study titled “How costs to connect biomethane to gas grids are paid for” on behalf of the European Biogas Association (EBA). Across the EU, connection cost allocation practices vary significantly: costs may be covered by the biomethane producer, grid operators, end users via tariffs, or shared through a combination of mechanisms. Currently, there is no comprehensive overview of how these connection costs are distributed in EU Member States.
The aim of this study was to examine how the costs of integrating biomethane into the gas grid are allocated between producers and infrastructure companies across EU countries. The research disaggregates infrastructure-related investments into individual cost components and analyzes each in detail.
EU Member States Overview
The EU has over 2 million kilometers of gas distribution pipelines. Their large extent and low operating pressure explain why the majority of biomethane plants (58%) are connected to distribution grids.
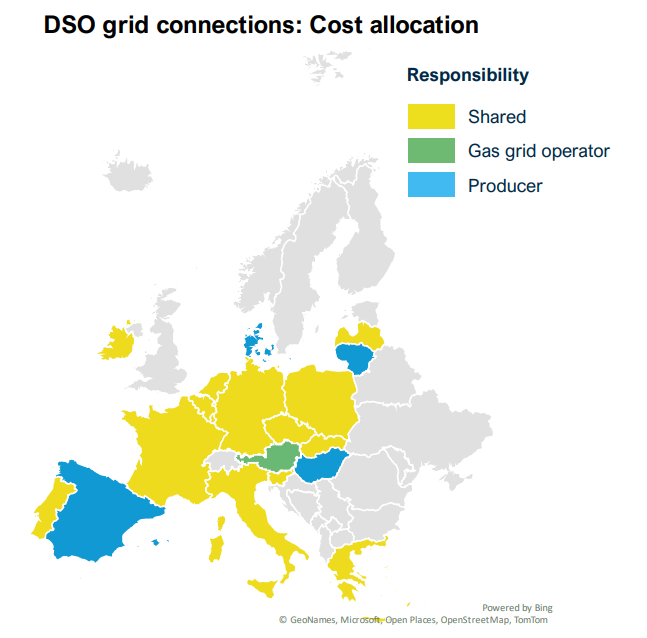
In most EU countries, connection costs to the distribution grid are generally shared between the biomethane producer and the grid operator. However, allocation methods differ substantially. Approximately 70% of plants connected to distribution grids are located in France, where producers cover all costs except the “last mile” of the pipeline, which is calculated based on pipeline length. Other countries apply regulated percentage-based allocations (Germany, Ireland), some divide CAPEX and OPEX responsibilities (Estonia, Portugal), while others employ more granular component-based allocation methodologies.
The EU’s transmission network spans over 260,000 km, enabling long-distance transport of methane to major industries and storage sites.
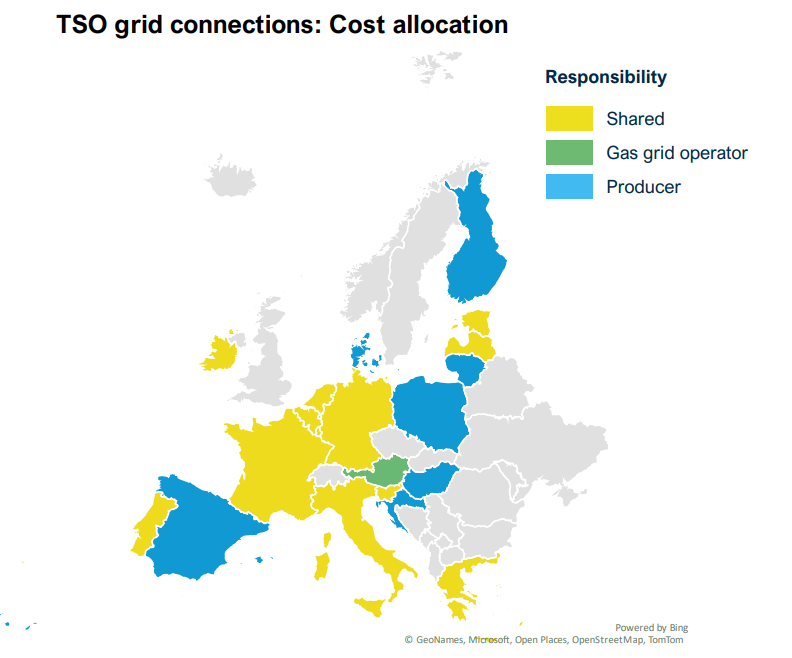
Direct connection of biomethane plants to transmission grids is less common due to high pressure and compression costs. However, in countries like Germany, Finland, and Italy, local conditions and larger average plant sizes make transmission connections more viable.
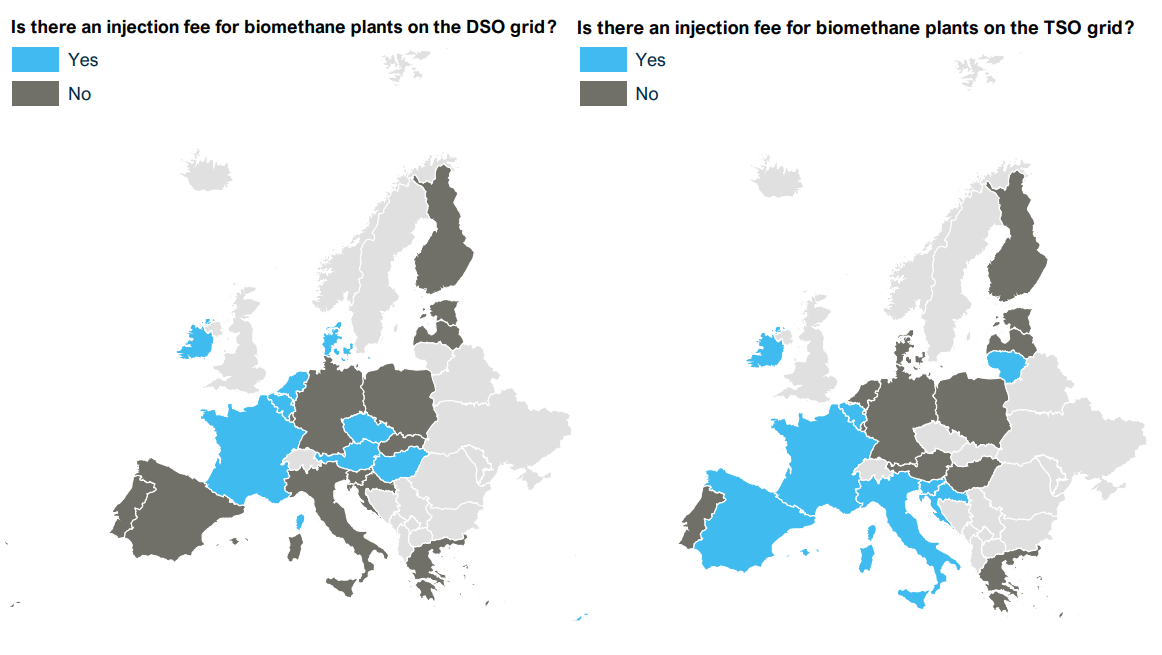
There is no harmonized approach to injection fees. Some countries waive them for biomethane producers, while others — including both mature and emerging markets — impose such fees. In total, 9 distribution system operators and 8 transmission system operators in the EU currently charge injection fees.
Top 5 Biomethane Markets in the EU
France
-
2030 potential: 5.1 bcm
-
2040 potential: 14.6 bcm
-
Plants connected to transmission: 106
-
Plants connected to distribution: 642
Transmission grid: ~38,000 km (16–95 bar)
Distribution grid: ~195,000 km (4–25 bar)
Germany
-
2030 potential: 7.6 bcm
-
2040 potential: 15.5 bcm
-
Plants connected to transmission: 106
-
Plants connected to distribution: 52
Transmission grid: ~47,000 km (>16 bar)
Distribution grid: ~557,000 km (≤16 bar)
Italy
-
2030 potential: 5.7 bcm
-
2040 potential: 10.3 bcm
-
Plants connected to transmission: 40
-
Plants connected to distribution: 7
Transmission grid: ~24,000 km (>5 bar)
Distribution grid: ~272,000 km (<5 bar)
Netherlands
-
2030 potential: 1.2 bcm
-
2040 potential: 2.3 bcm
-
Plants connected to transmission: 4
-
Plants connected to distribution: 90
Transmission grid: ~12,000 km (40–80 bar)
Distribution grid: ~123,600 km (8 bar)
Denmark
-
2030 potential: 0.8 bcm
-
2040 potential: 1.8 bcm
-
Plants connected to transmission: 1
-
Plants connected to distribution: 57
Transmission grid: ~860 km (80 bar)
Distribution grid: ~18,000 km (3,000 km of which >40 bar)
Key Findings
Around 60% of biomethane plants in the EU are connected to distribution networks. Cost-sharing practices are more prevalent for distribution grid connections, largely due to broader experience across Member States. In contrast, transmission grid connections involve less frequent cost-sharing, likely due to limited experience in this area.
The study breaks down each type of grid connection or upgrade into key components and outlines financial and operational responsibilities for each. The following cost allocation methods were identified:
-
Split between CAPEX and OPEX
E.g., Portugal – producer pays capital costs; DSO covers operational costs. -
Regulated percentage share
E.g., Germany – grid operator covers 75% of the connection costs. -
Component-level cost sharing
E.g., the “last mile” pipeline in the Netherlands is financed by the TSO.
Some grid operators also help reduce the upfront financial burden on producers by covering initial investments and recovering them through user fees over time. This model improves liquidity and lowers investment risk, even though producers eventually bear the cost.
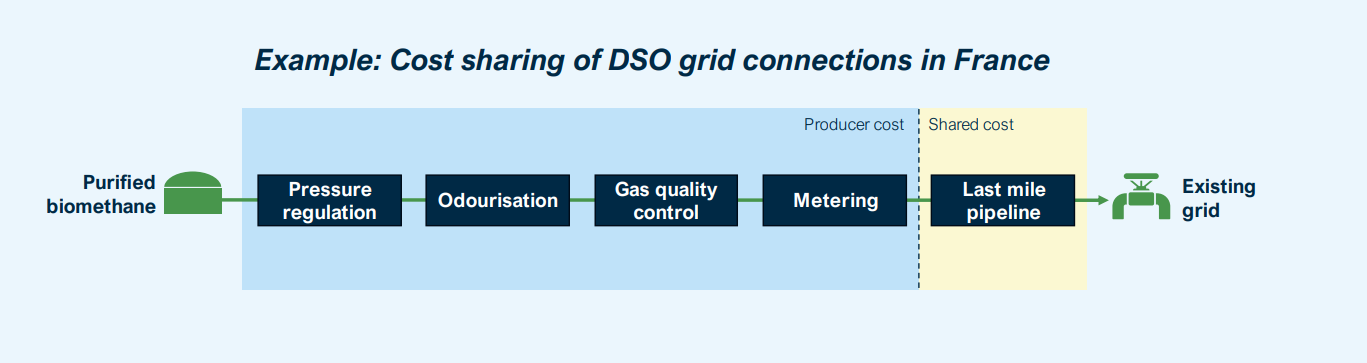
The study also examines the operational responsibility for each type of connection and component, as illustrated below using the example of connections to distribution networks in France.
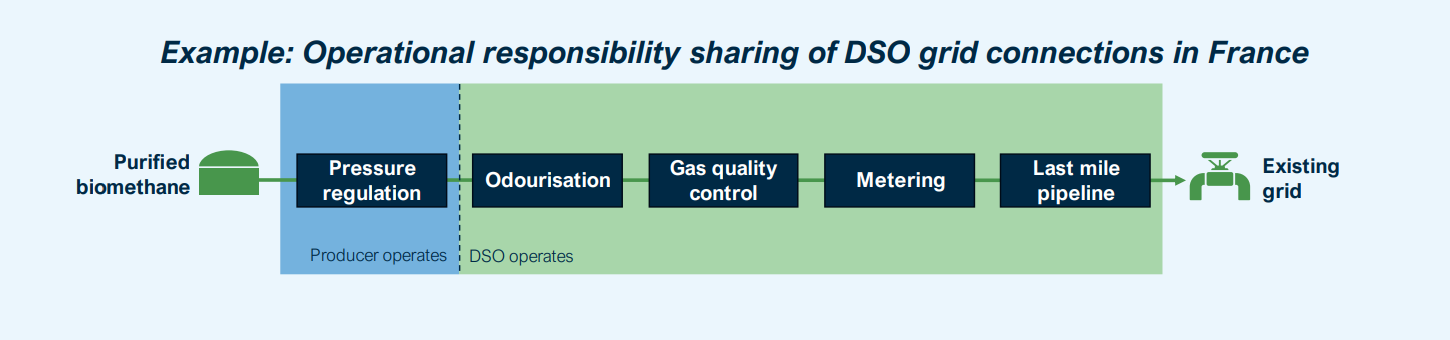
Operational responsibility also varies across Member States. “Last mile” pipelines and odorization systems are typically handled by grid operators. Gas quality control and metering may be shared or vary, depending on national regulations. Pressure regulation usually falls under the producer’s scope — especially where compression is required.