The Bioenergy Europe has published a new statistical report Bioenergy Landscape 2024, which provides a detailed analysis of the role of bioenergy in the European energy sector.
Given the importance and scope of the topic, this review will contain three parts. We are currently publishing the first part, and the second (heat and electricity) and third (biofuels, biogas, biomethane, etc.) will be published later.
Bioenergy (the leading renewable energy source today) contributes significantly to the EU’s decarbonisation targets and offers solutions for energy security, economic and sustainable development. The report provides data on energy consumption, production, imports, greenhouse gas (GHG) emissions and socio-economic impacts of the bioenergy sector.
Source: Bioenergy Europe.
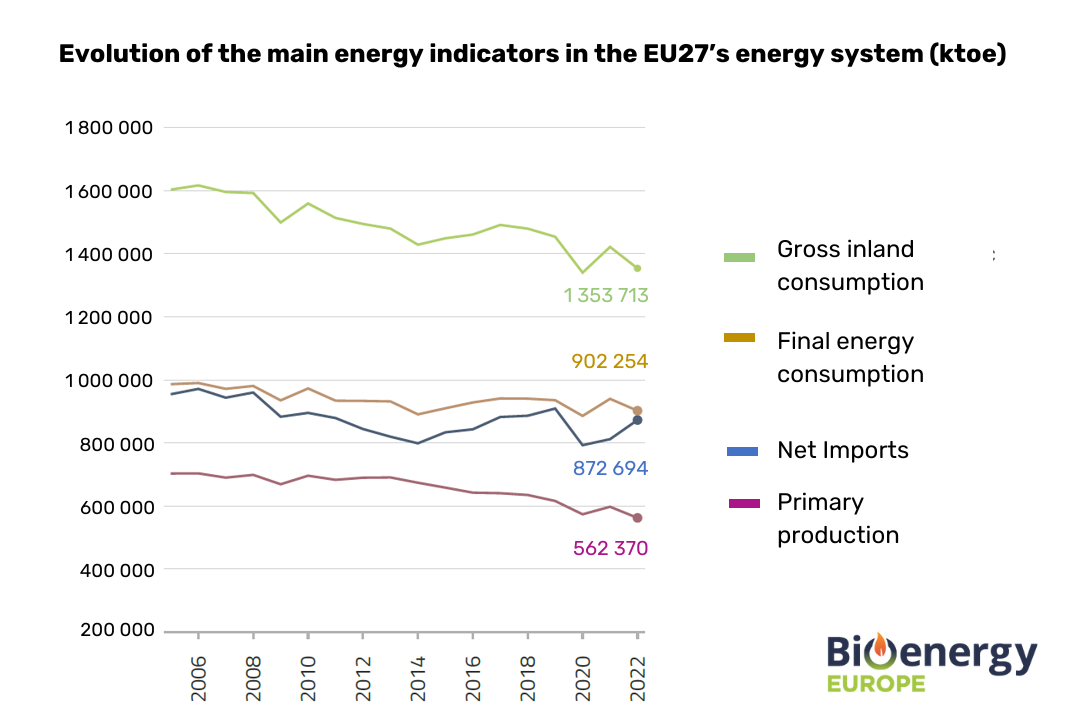
An overview of the European energy system, including primary production, net imports, gross inland consumption and final energy consumption, shows that in 2022:
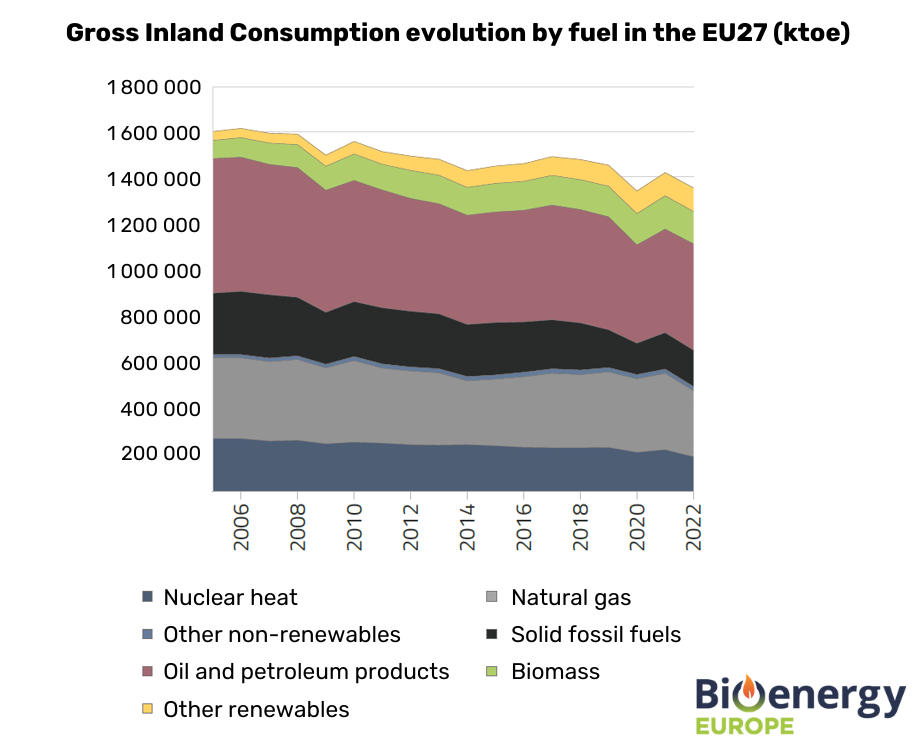
- The EU’s gross inland consumption was dominated by fossil fuels (70% share). At the same time, there was an increase in two sources: consumption of oil and oil products grew by 2.7% and other renewable energy sources (mainly wind and solar) grew by 1.5%. The most significant setback lies in the persistent stability of solid fossil fuel consumption, which has not decreased despite commitments highlighted at COP26.
- Net imports of Energy have growth of 7,5%. Reaching now 872 Mtoe, imports were in 2022 almost the equivalent of EU final consumption (902 Mtoe). This demonstrates the problem of the EU’s energy dependence on energy imports.
- Biomass remains the most locally sourced fuel for Europe. Bioenergy accounted for 13% of total final consumption in the EU27
Renewable energy sources account for 23% of the EU’s energy mix. Biomass is the leading source of renewable energy (54%), followed by hydropower and wind power.
Source: Bioenergy Europe.
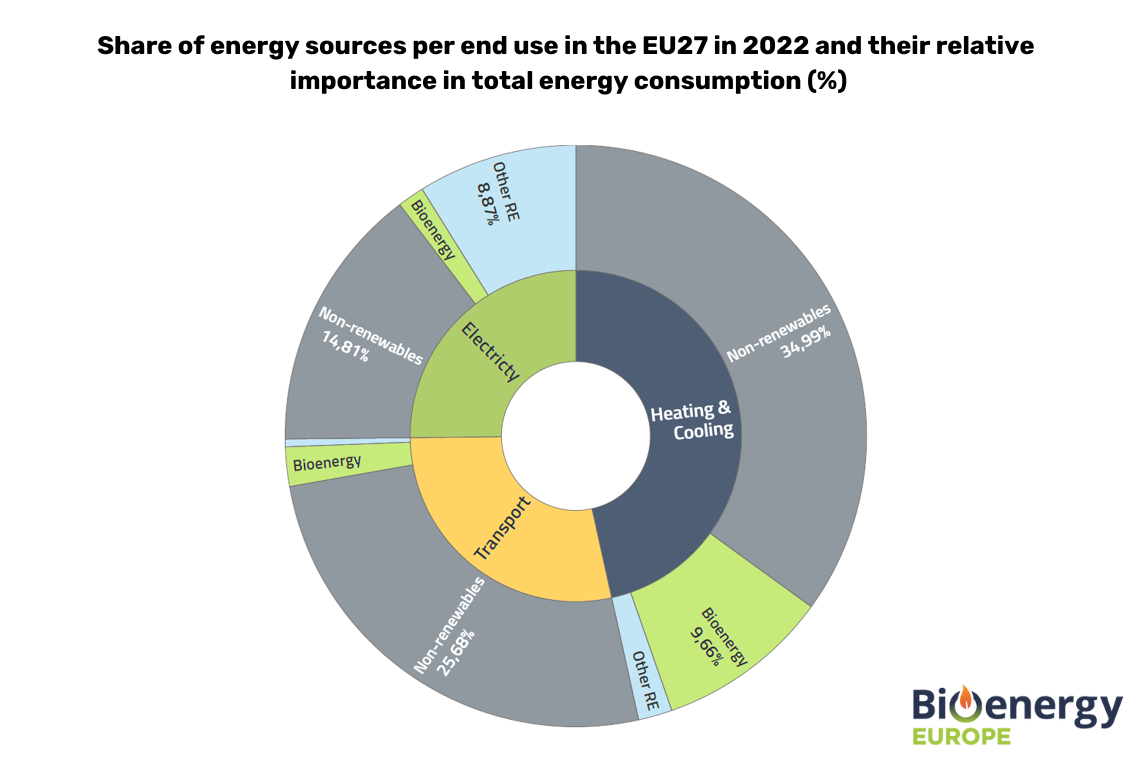
Without bioenergy, the share of renewable energy in Europe would drop significantly to less than 11%. In this scenario, the sectors most impacted would be:
- heating and cooling, where the renewable share would plummet from 25% to 4%;
- transport, the share of renewables in which will decline from 10% to a mere 1%.
Source: Bioenergy Europe.
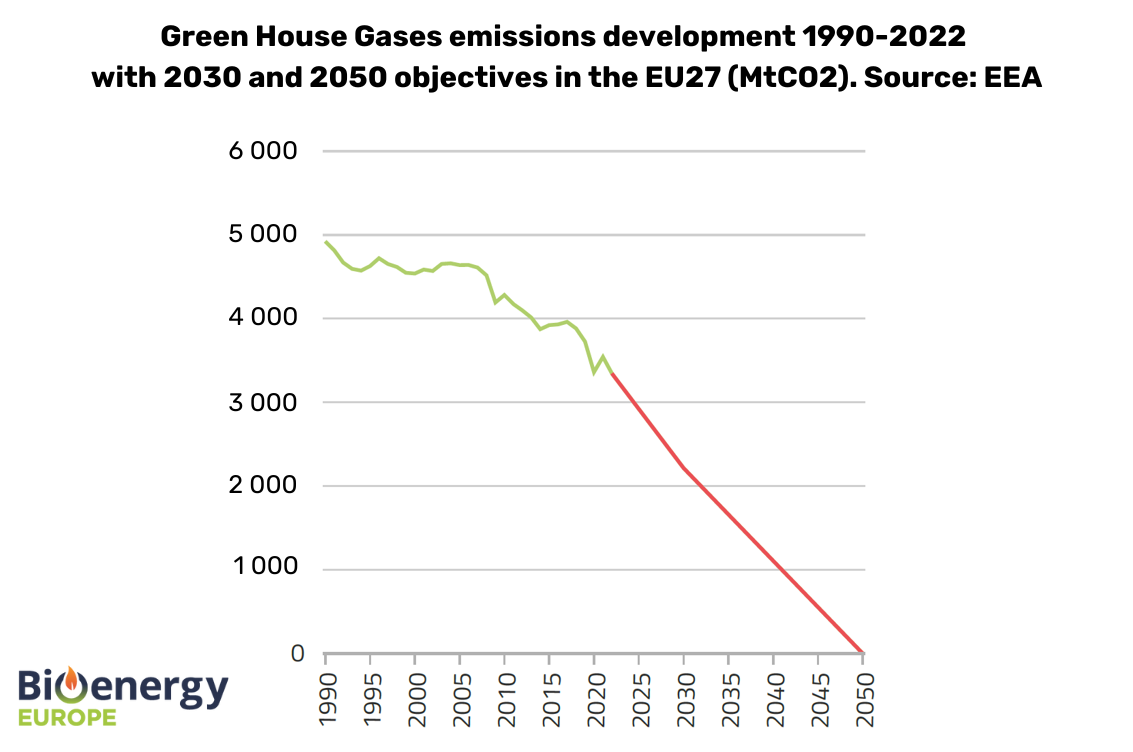
In 2022, GHG emissions have started to pursue their decreasing trajectory in 2022 after a trend inversion in 2021. The midterm objective of reducing 1990’s CO2 emissions by 45% in 2030 can still be achieved. The goal for 2030 is to reach 2214 MtCO2 which, starting from 2021, represent a decrease of 147 MtCO2 per year. With a reduction of 197 MtCO2 achieved between 2021 and 2022, the target remains within reach, provided similar or accelerated progress continues.
Source: Bioenergy Europe.
In 2022, only two sectors (energy industries and transport) are increasing their emissions compared to 2021. The rise in transport emissions aligns with the gradual recovery from the pandemic-related restrictions of 2020. In the energy industry, increased coal combustion has contributed to higher emissions. However, these increases have been offset by reductions in emissions across other sectors.
Source: Bioenergy Europe.
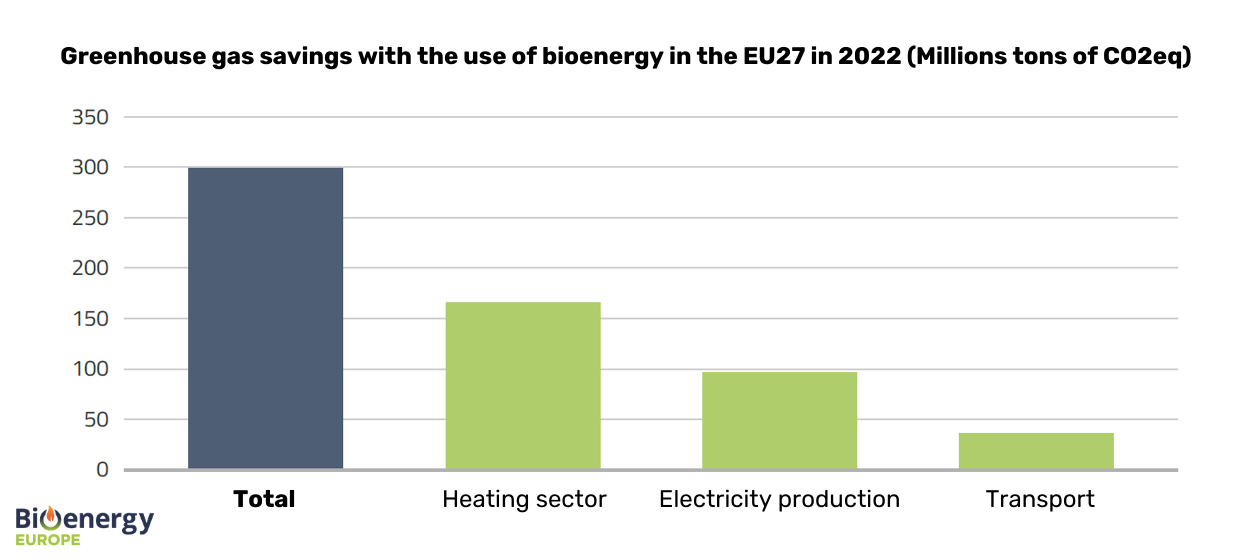
The bioenergy sector reduced 300 million tonnes of CO2 emissions in 2022. This confirms its important role in achieving climate goals. Integration of bioenergy with carbon capture and storage (BECCS) technology could further sequester millions of tons annually, accelerating climate goals. By relying on European know-how and leveraging on the abundant local biomass, BECCS can play a role in promoting the EU industrial competitiveness. Furthermore, it can be a viable solution for hard-to-abate sector’s emissions.
Note
The report primarily uses Eurostat 2022 data available at the time of publication. They are supported by input data from the European Biogas Association (EBA) and FAO databases. Using different sources can sometimes lead to small differences in the data presented, mostly due to methodological differences. This is the case for example when comparing biogas data, where Eurostat doesn’t include biomethane under their Biogases classification and therefore provides slightly smaller numbers when compared to the data coming from the European Biogas Association, depicting a more accurate picture of what is actually being consumed. Therefore, some amendments have been made to calculate the new figures and to provide a more detailed understanding of the EU’s energy dynamics.
This review for SAF Ukraine was prepared by Semen Drahniev, an expert at the Bioenergy Association of Ukraine.