 The use of biomass to replace fossil fuels reduces emissions of greenhouse gases into the atmosphere, in particular, carbon dioxide (CO2), which contributes to the achievement of decarbonization goals. Reduced carbon emissions can become an additional source of income for bioenergy enterprises in Ukraine if the appropriate economic mechanism will be introduced. In recent years, carbon pricing has become a key policy tool in the fight against climate change for many governments. The recently published World Bank report “State and Trends of Carbon Pricing” (2024) provides a comprehensive overview of the situation with carbon pricing instruments worldwide.
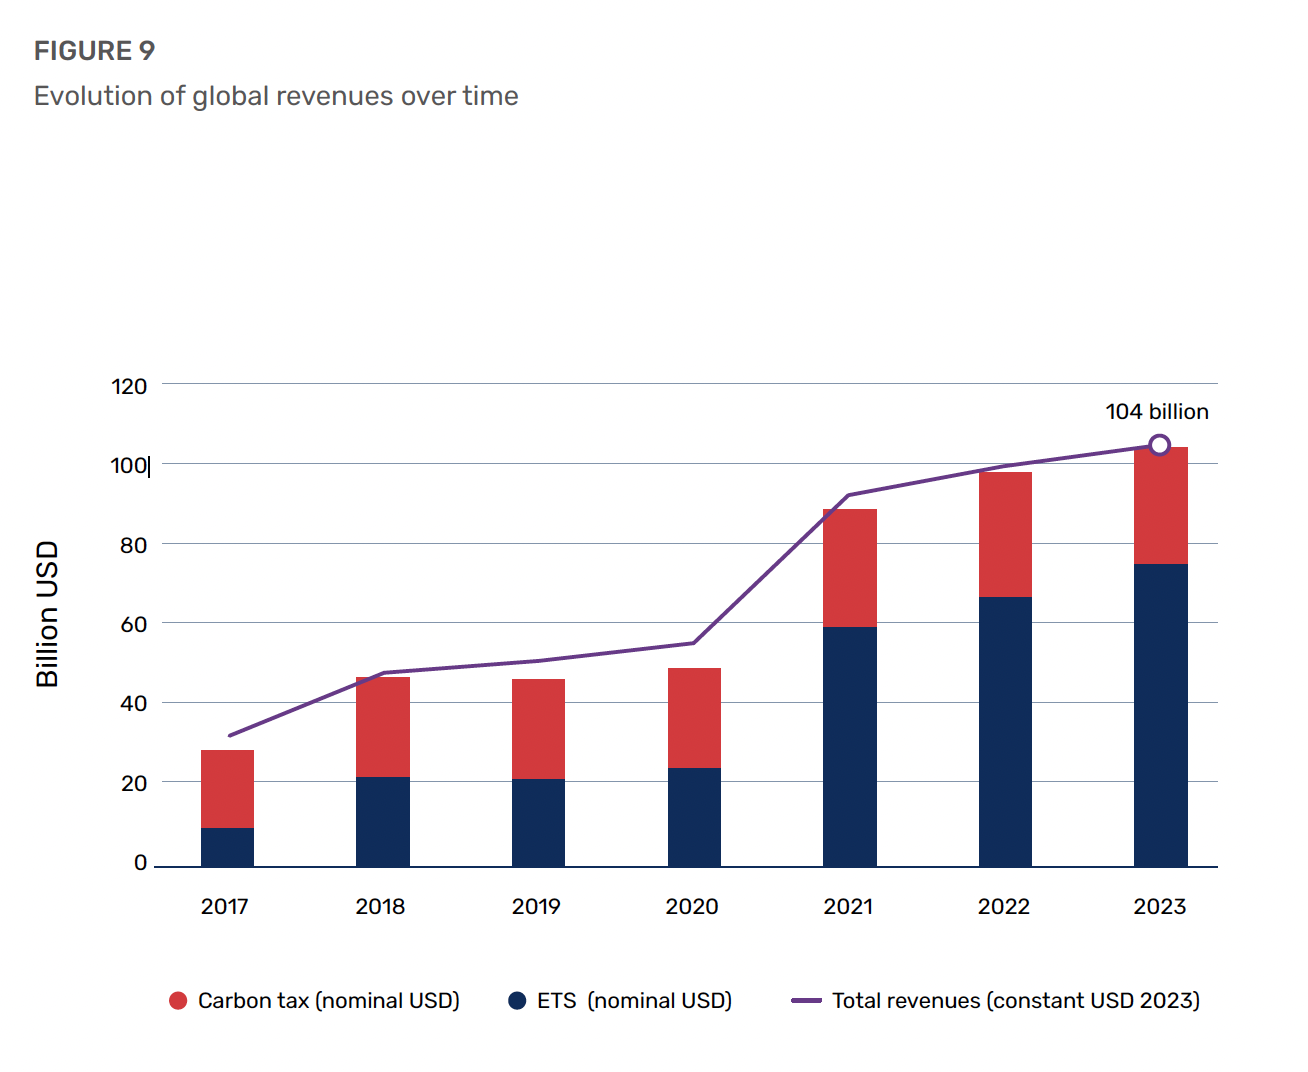
Thus, total revenues from carbon taxes and ETSs in 2023 reached a record level of $104 billion (Figure 9). This significant revenue proves the growing adoption of carbon pricing mechanisms.
According to the report, almost a quarter of global greenhouse gas emissions are now covered by 75 instruments (Figure 4), which can be divided into two main types:
- Carbon tax: a direct tax on the carbon content of fossil fuels. It puts a clear price on carbon, encouraging lower emissions.
Emissions trading systems (ETS): also known as cap-and-trade systems, which set limits (caps) on emissions and allow economic operators to buy and sell emission permits, creating a market price for greenhouse gas emissions.
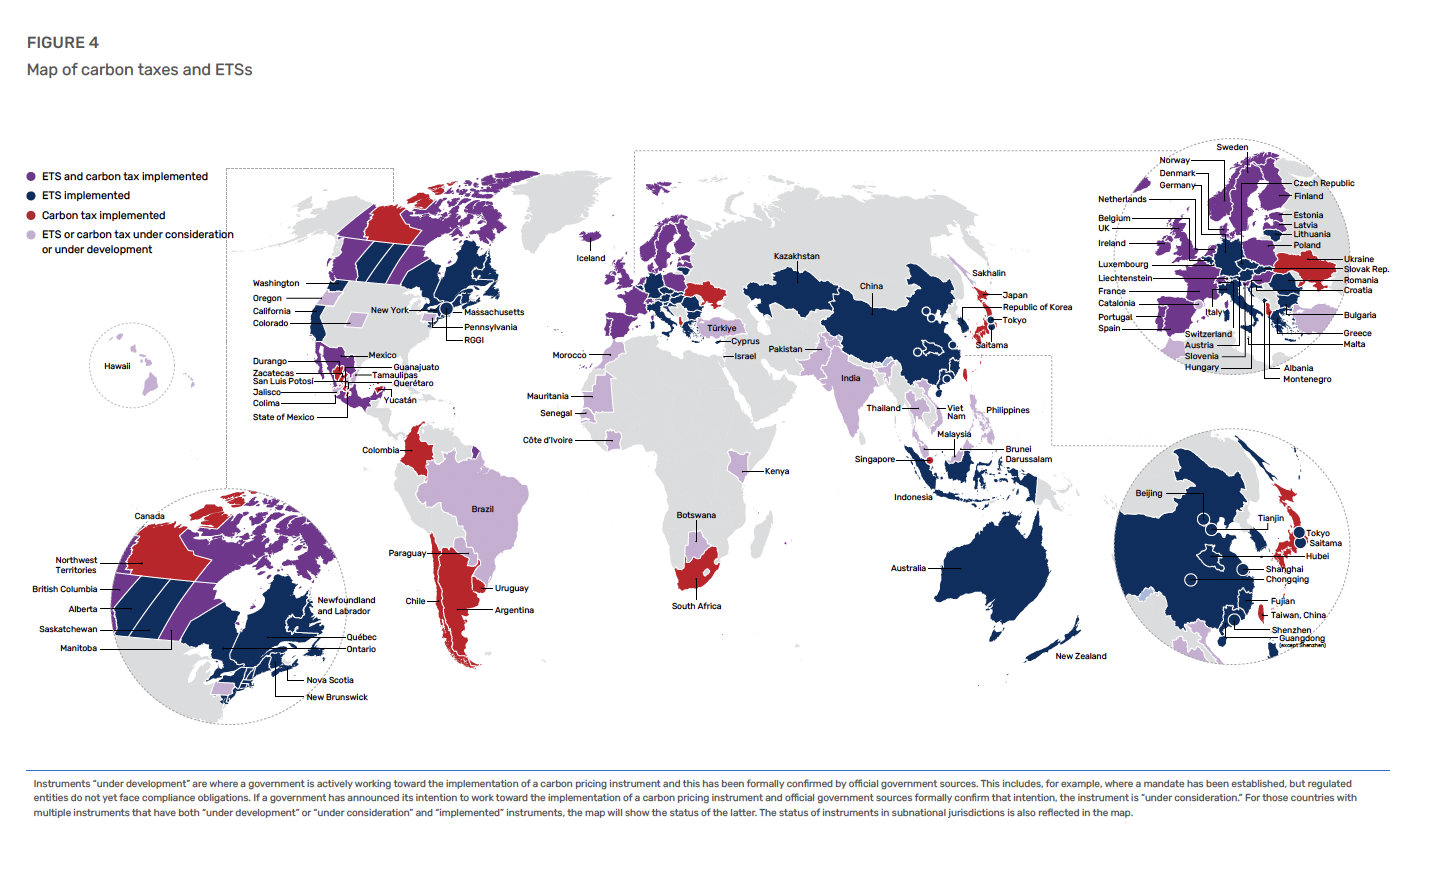
Middle-income countries and subnational governments are increasingly considering and implementing carbon taxes and ETSs. There are now slightly more carbon taxes in operation than ETSs. (39 taxes versus 36 ETSs). As of April 1, 2024, ETS and carbon taxes covered nearly 13 GtCO2eq (Figure 5), which accounted for approximately 24% of global greenhouse gas emissions. Over the past 12 months, progress has been made on sectoral multilateral initiatives on aviation and maritime emissions, and the Carbon Border Management Mechanism (CBAM) has been introduced. Despite this progress, the level of global emissions covered by carbon tariffs is unlikely to reach 30% in the short term.
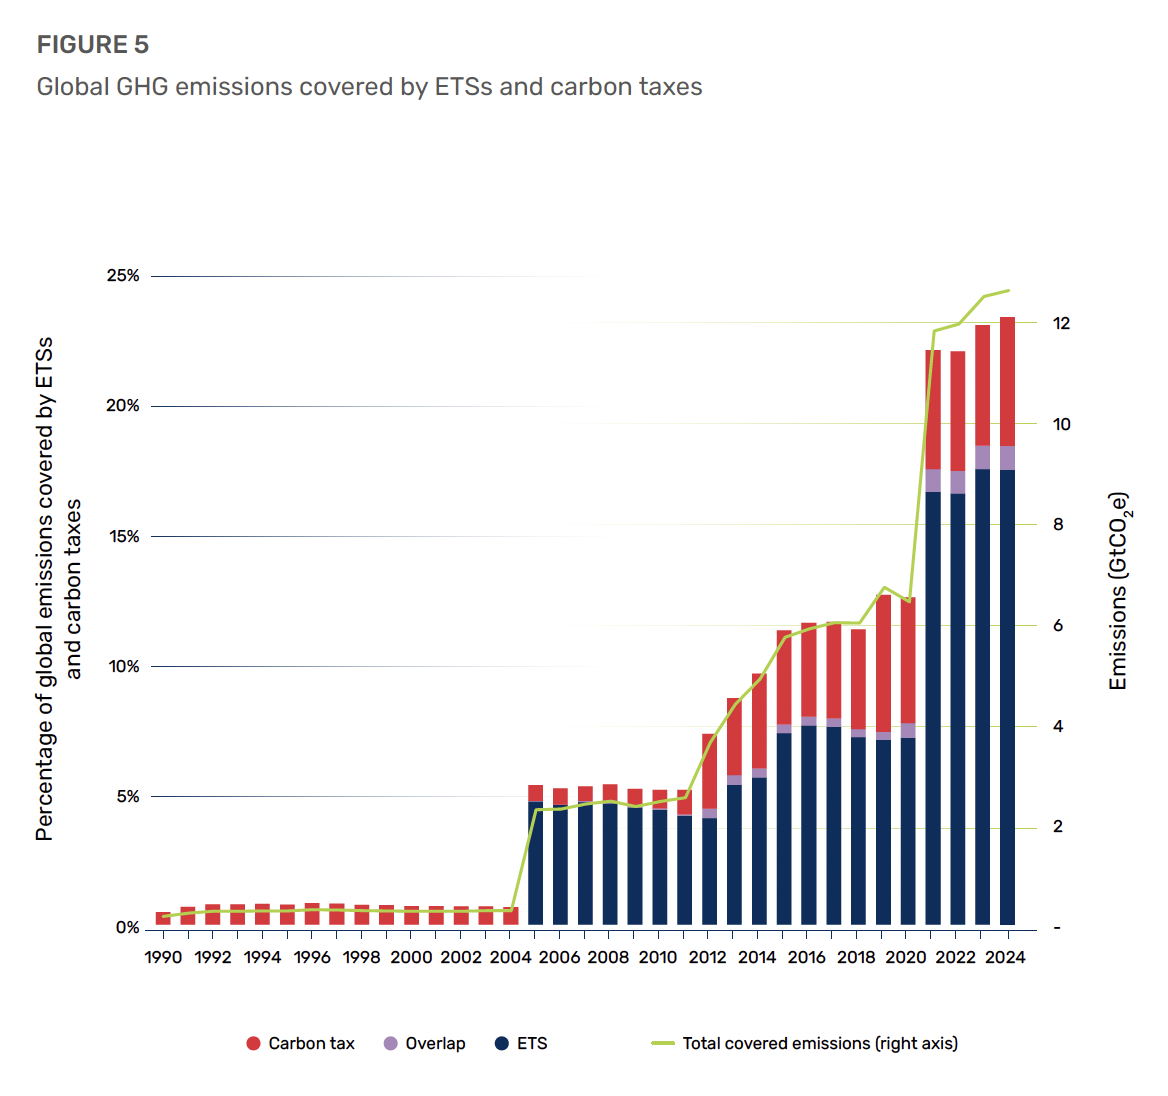
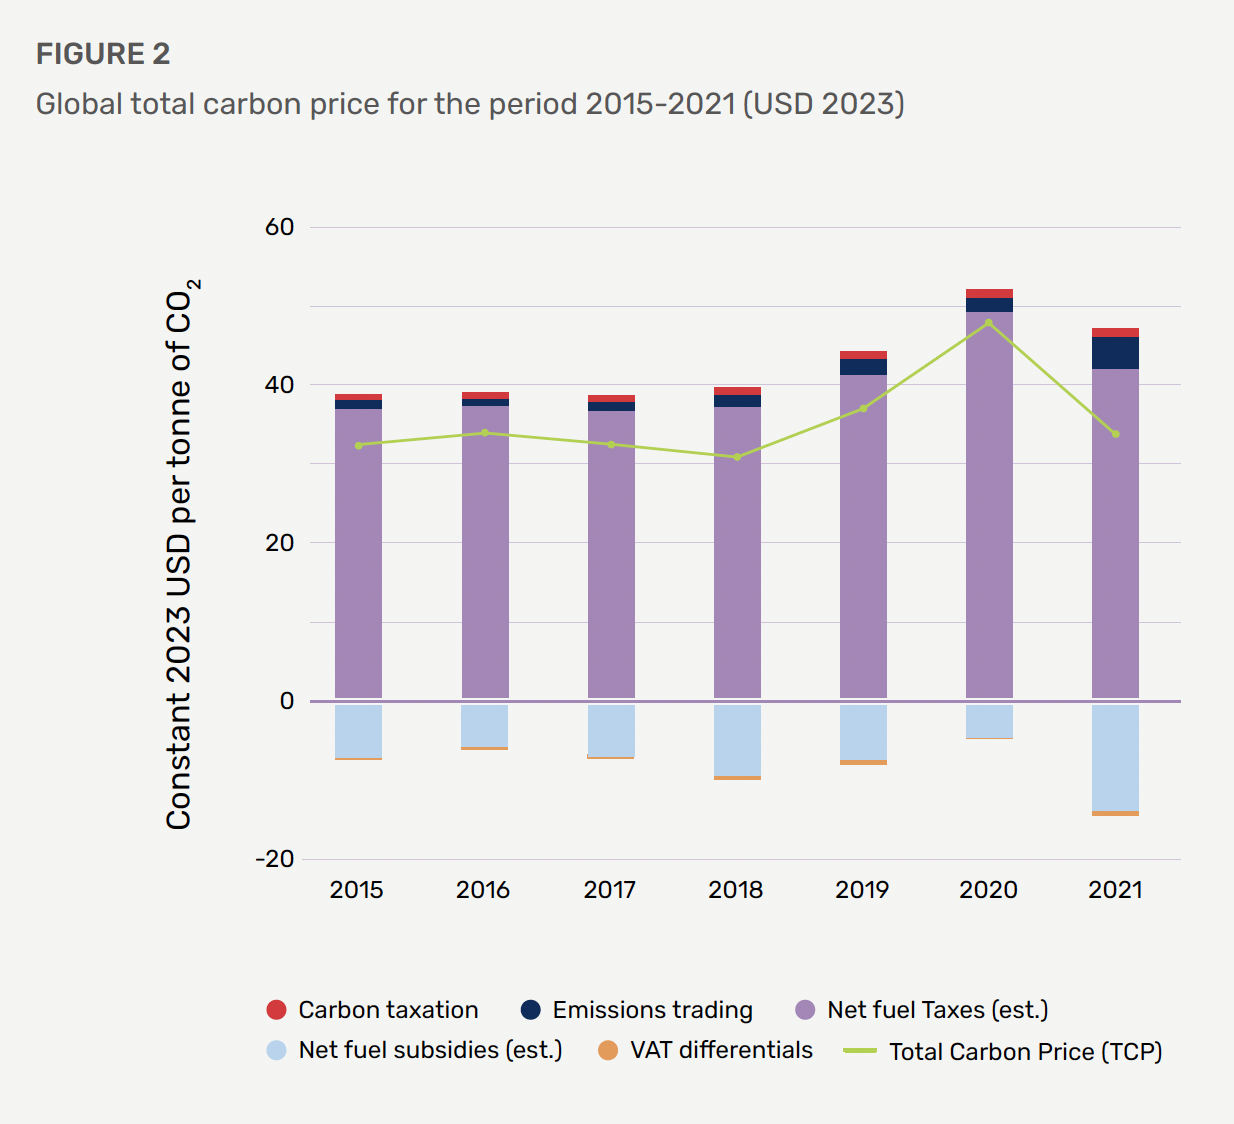
Figure 2 shows the dynamics of changes in the global total carbon price since 2015 using a combination of collected and estimated data. In 2021, there was a decrease in the CO2 price compared to 2020. This confirms the impact of fuel taxes on driving carbon prices, as well as the negative impact of fossil fuel subsidies. Carbon pricing remains insufficient despite a decade of strong growth.
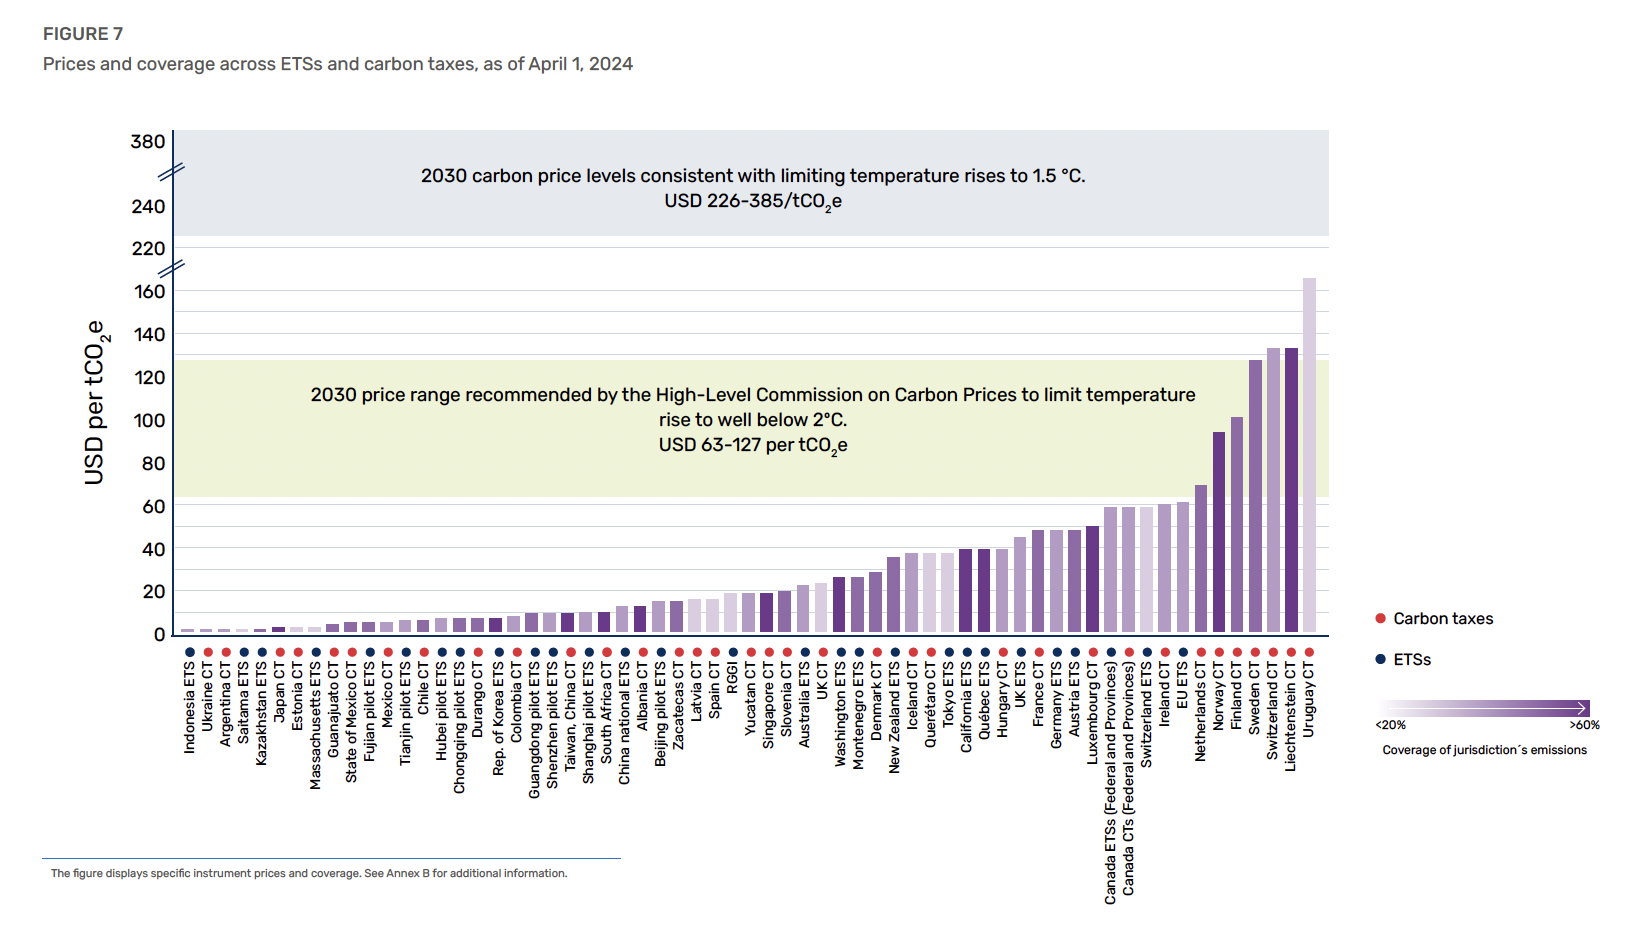
Despite progress, carbon pricing remains inconsistent with the ambitious climate targets set by the Paris Agreement. In order to achieve significant changes, it is necessary to improve both the coverage of carbon emissions and to raise the level of their price (Figure 7). Estimated values of the price of carbon emissions for achieving the goals of limiting the increase in global temperature to 1.50°C are $226-385 per t of CO2 eq., and the limit to 20°C is $63-127 per t of CO2 eq. In 2024, only seven carbon pricing instruments accounting for less than 1% of global greenhouse gas emissions achieved prices at or above the inflation-adjusted floor of $63 per t of CO2 eq. For example, in Ukraine in 2024 there will be a tax on carbon dioxide emissions in the amount of $0.77 per t of CO2 eq. (30 UAH per t of CO2 eq.), which is one of the lowest prices for carbon emissions in the world.
Governments, especially in middle-income countries, are increasingly incorporating carbon credit schemes into their policies to support both compliance and voluntary markets. Demand for carbon credits continues to be largely driven by voluntary purchases, although demand for regulatory compliance is emerging. There are currently 35 government carbon credit mechanisms in the world and new supply and demand for such credit is emerging.
The World Bank is committed to supporting governments and the private sector in their efforts to reduce emissions through carbon pricing and carbon markets. As the role of carbon pricing changes, the potential complexity of policy development in both domestic and global contexts grows. This increases the need for cooperation, transparency and the provision of accurate and timely information and analysis. The World Bank contributes to these efforts by providing information and analysis presented in “Carbon Pricing State and Trends” products, including facilitating access to carbon pricing data and carbon credit market data through the upgraded “State and Trends dashboard carbon pricing” (https://carbonpricingdashboard.worldbank.org/).
Source: World Bank. 2024. State and Trends of Carbon Pricing 2024. Washington, DC: World Bank. DOI: 10.1596/978-1-4648-2127-1. License: Creative Commons Attribution CC BY 3.0 IGO: https://openknowledge.worldbank.org/server/api/core/bitstreams/253e6cdd-9631-4db2-8cc5-1d013956de15/content.